What are the most universal screens across mobile apps — and which are rare?
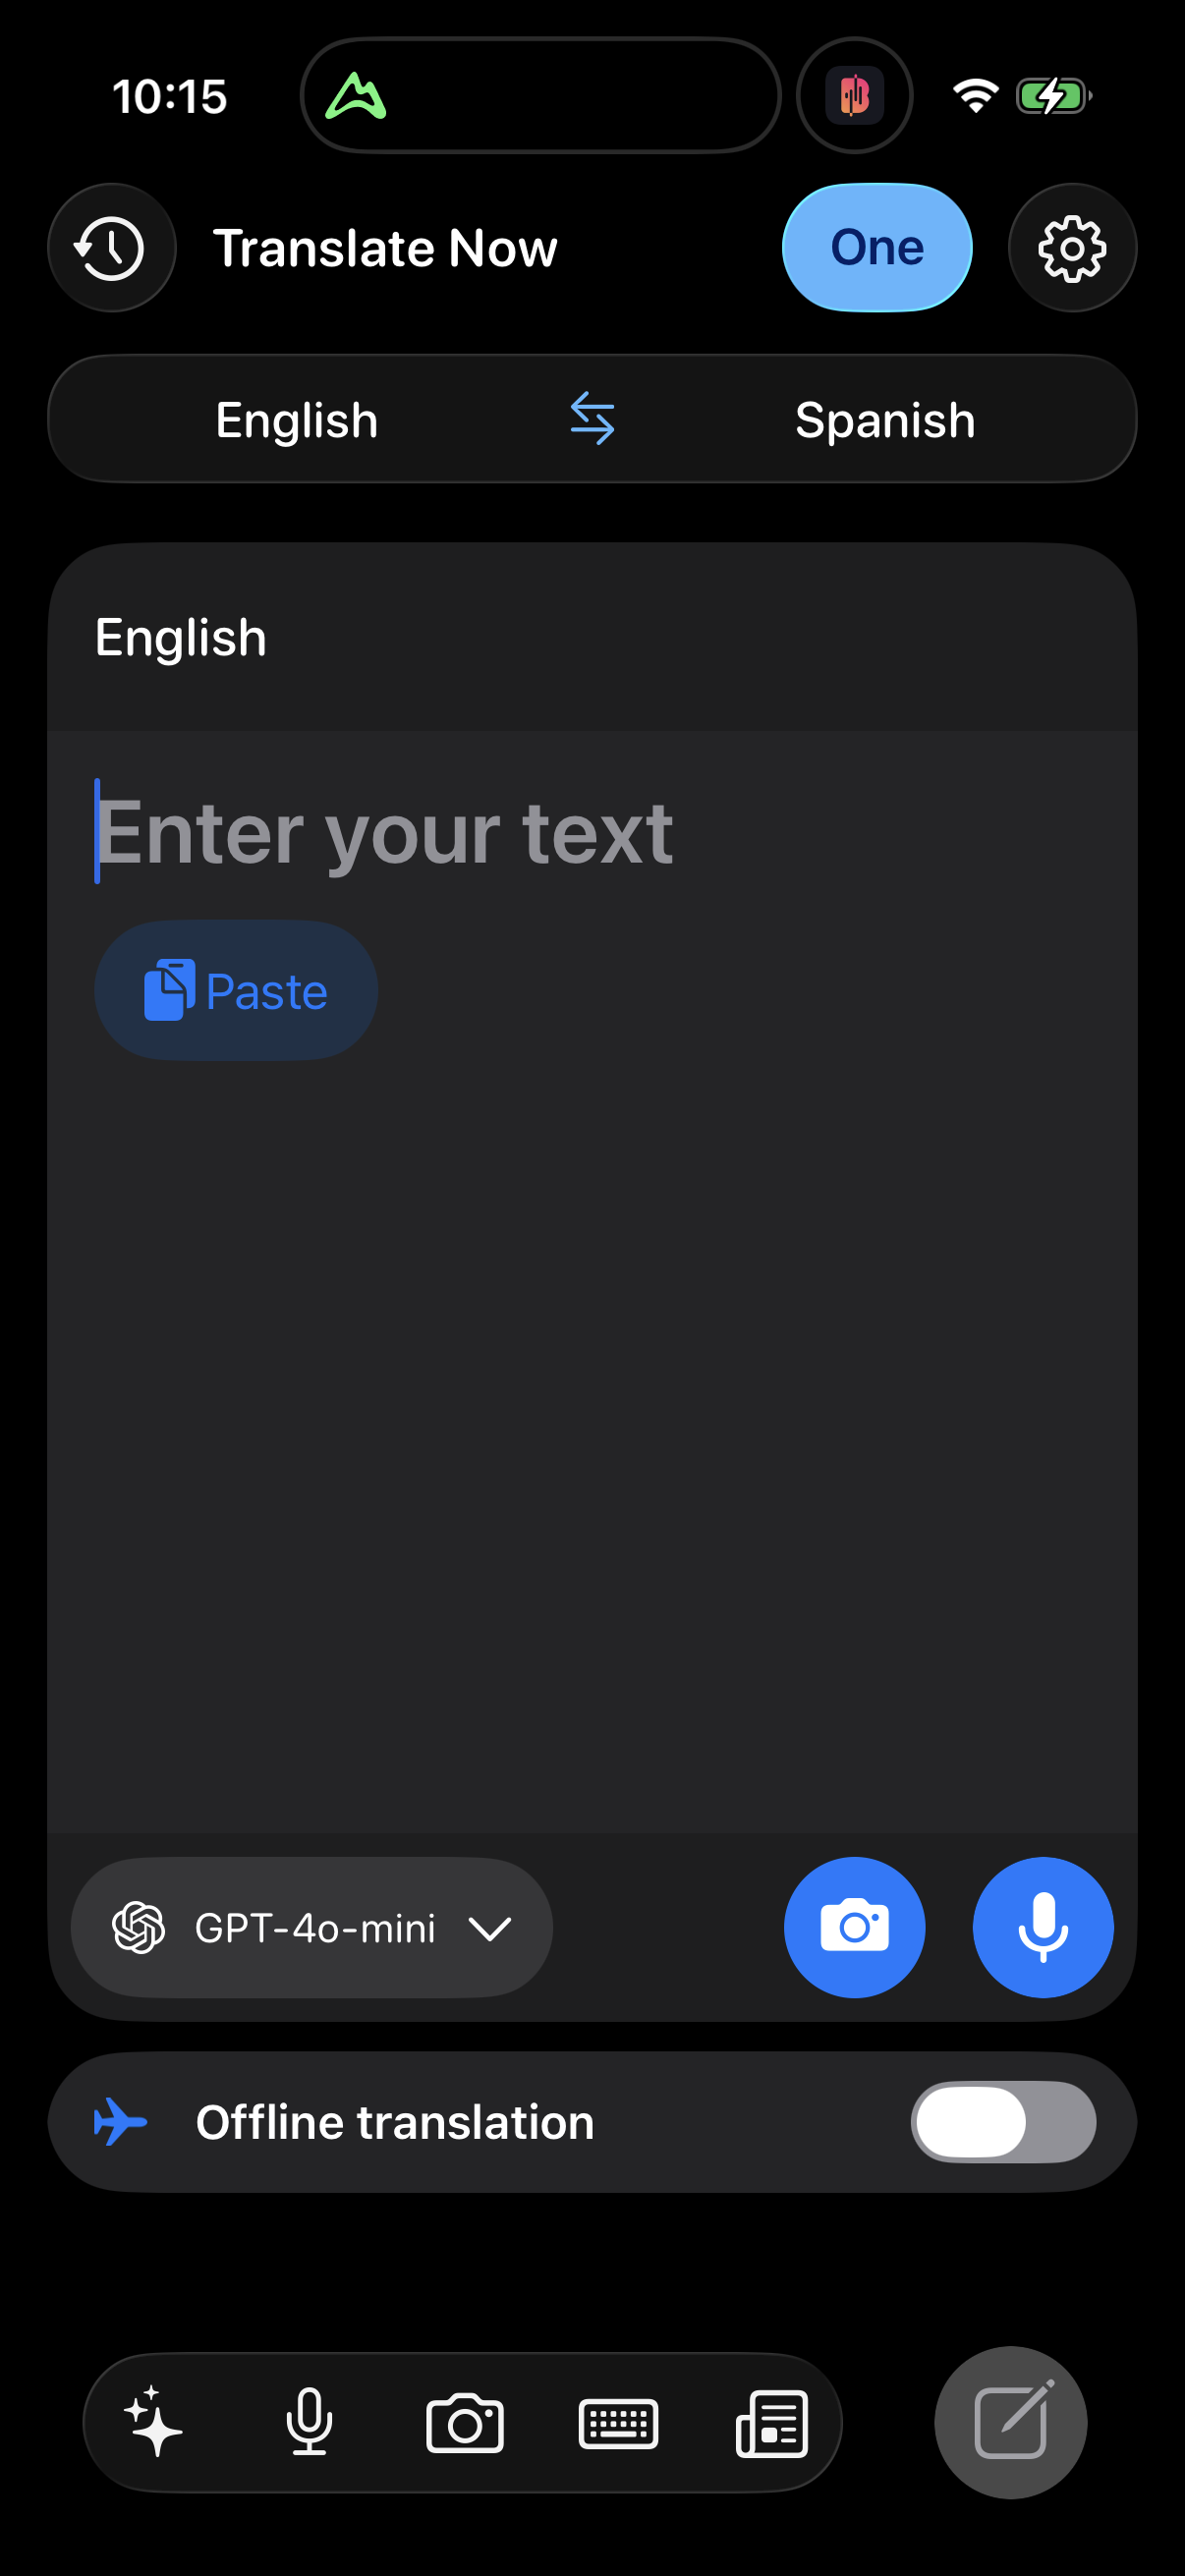
Settings is the most universal non-home screen, in 71.4% of tracked apps (578 of 809), followed by profile (58.0%) and search (55.6%) [1]. At the other end, onboarding quizzes (13.3%), streaks (11.6%), and leaderboards (6.8%) are rare, niche patterns [2]. Use this ladder to judge whether any screen you're debating is expected or optional.
Settings (71.4%) is the most universal non-home screen; leaderboards (6.8%) the rarest — across ~800 tracked apps, July 2026.
| Item | % |
|---|---|
| Settings | 71.4% |
| Profile / account | 58.0% |
| Search | 55.6% |
| In-flow upsell (upper bound) | 46.2% |
| Empty state | 45.7% |
| Social login | 40.7% |
| Notification primer | 39.9% |
| Paywall | 37.7% |
| Checkout / cart | 33.4% |
| Referral | 25.3% |
| Dark mode | 19.0% |
| Biometric login | 16.6% |
The prevalence ladder
Ranked prevalence across 809 tracked apps [1][2]:
| Screen | Apps | % |
|---|---|---|
| Settings | 578 | 71.4% |
| Profile / account | 469 | 58.0% |
| Search | 450 | 55.6% |
| In-flow upsell (upper bound) | 374 | 46.2% |
| Empty state | 370 | 45.7% |
| Social login | 329 | 40.7% |
| Notification primer | 323 | 39.9% |
| Paywall | 305 | 37.7% |
| Checkout / cart | 270 | 33.4% |
| Referral | 205 | 25.3% |
| Dark mode | 154 | 19.0% |
| Biometric login | 134 | 16.6% |
| Onboarding quiz | 108 | 13.3% |
| Rating request | 103 | 12.7% |
| Celebration | 96 | 11.9% |
| Streaks | 94 | 11.6% |
| AI assistant | 88 | 10.9% |
| Widget upsell | 69 | 8.5% |
| Leaderboard | 55 | 6.8% |
How to apply it
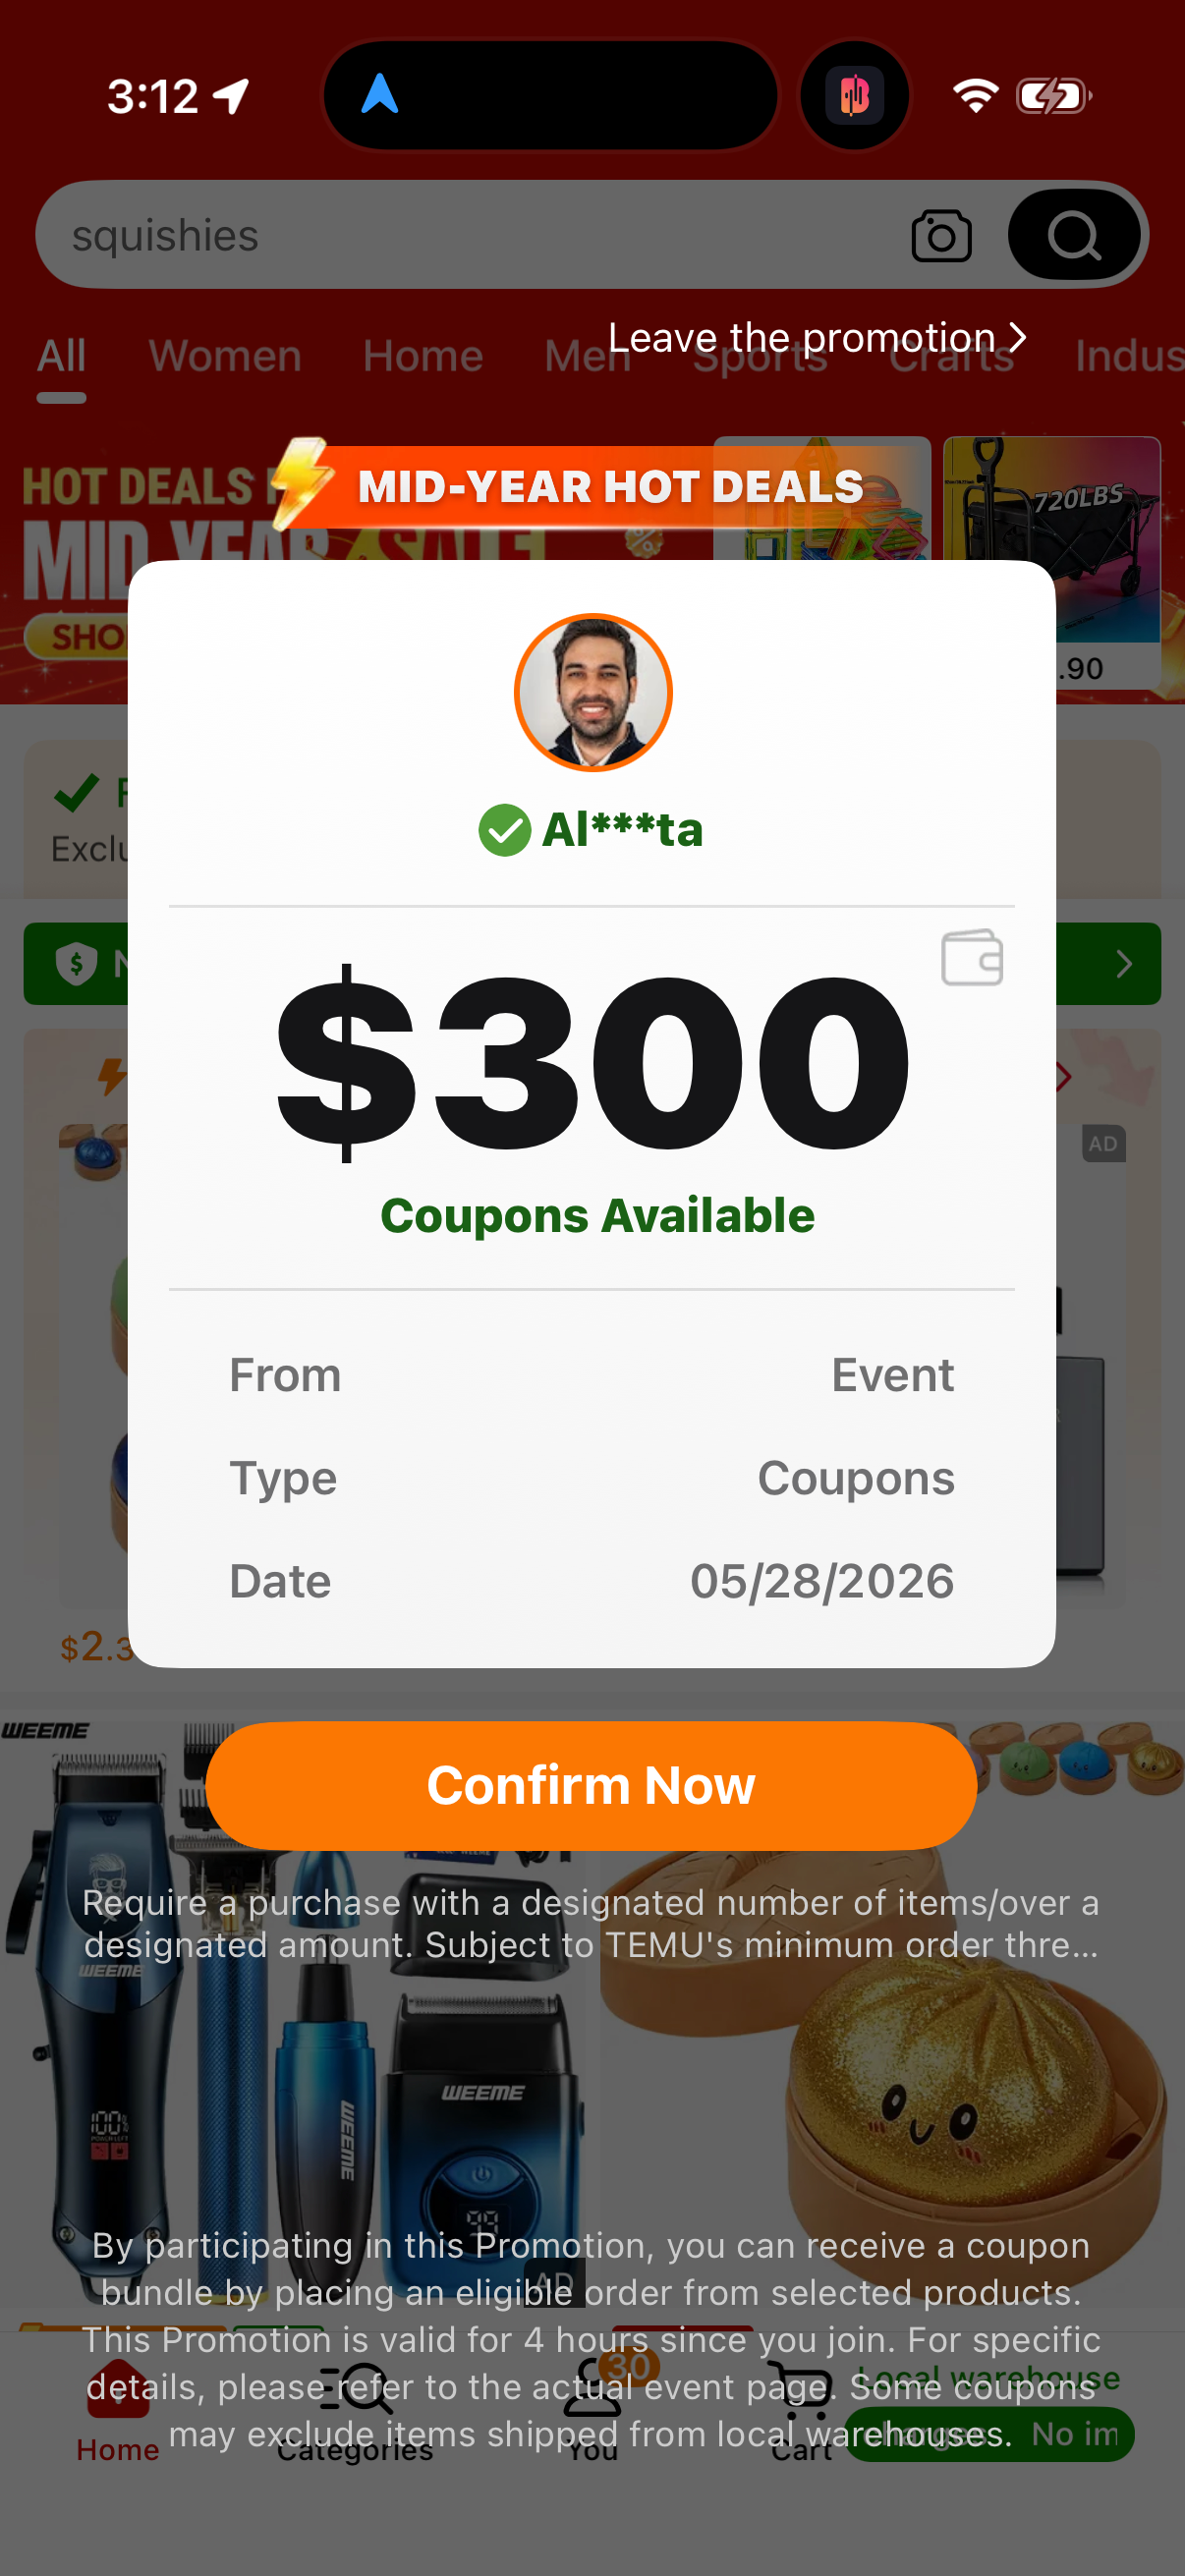
Use the ladder as a table-stakes-vs-optional test. Anything above ~50% (settings, profile, search) is an expected screen — its absence is a gap to justify. Patterns in the 30-45% band (upsell, empty state, social login, notification primer, paywall, checkout) are common but genuinely optional and category-dependent. Below ~20% (dark mode, biometric, quizzes, streaks, AI, widgets, leaderboards) are differentiators you add on purpose, usually because your vertical rewards them.
Caveats
Every figure is a lower bound on captured screens (median 41/app) [1]. The in-flow upsell figure (46.2%) is a flagged upper bound because '%upsell%' also matches subscription upsells [2]. All figures are COUNT(DISTINCT company_name) over 809 apps, deduped; the denominator is never the 62,376-row companies table.
The numbers
| Stat | Computed from |
|---|---|
| Settings 71.4% (578), Profile 58.0% (469), Search 55.6% (450) | prevalence_settings_screen, prevalence_profile_screen, prevalence_search_screen |
| Onboarding quiz 13.3% (108), Streaks 11.6% (94), Leaderboard 6.8% (55); in-flow upsell 46.2% (374) upper bound | prevalence_onboarding_quiz, prevalence_streaks, prevalence_leaderboard, prevalence_checkout_upsell |
Sources & citations
- [1] Lazyweb Research analysis of 809 mobile apps (809 mobile apps with >=1 captured screen; 751 with tag data; median 41 screens/app), July 2026. Prevalence = COUNT(DISTINCT company_name) over LLM synonym tags; denominator is 809 tracked apps (reported conservatively over all apps-with-screens, not the 62,376-row companies table). Lower bound: only reflects screens Lazyweb captured (median 41/app). ↩
Source: Lazyweb Research — proprietary analysis of real, in-market app screens. Cite as Lazyweb Research, 2026-07-07.
Related questions
More in Mobile screen-pattern prevalence censuses (does everyone have X screen?) →