Mobile screen-pattern prevalence censuses (does everyone have X screen?)
40 data-backed questions on Mobile screen-pattern prevalence censuses (does everyone have X screen?), from Lazyweb Research — each answer cites proprietary analysis of real, in-market app screens.
Which screens do almost every mobile app have, and which are actually rare?
Across 809 tracked apps (median 41 captured screens each), the most universal non-home screen is settings, in 71% (578 of 809) of apps.[1] After that, prevalence drops fast: profile 58% (469), search…
What percentage of mobile apps have a settings screen?
71% of tracked apps have a settings screen — 578 of 809.[1] That makes it the single most universal non-home screen in the corpus, more common than profile (58%) or search (56%).[2] If you're auditin…
What percentage of mobile apps have a profile or account screen?
58% of tracked apps have a profile or account screen — 469 of 809.[1] It's the second most universal non-home screen after settings (71%), and more common than search (56%).[2] A profile screen is ty…
What percentage of mobile apps have a search screen?
56% of tracked apps have a search screen — 450 of 809.[1] Search is common but not universal: it trails settings (71%) and profile (58%) and sits just above the halfway mark.[2] Whether you need one…

What percentage of mobile apps have a dedicated empty-state screen?
46% of tracked apps have an explicit empty-state screen — 370 of 809.[1] That puts intentional empty states just below the halfway mark, on par with in-flow upsells and ahead of social login (41%).[2…
What percentage of mobile apps offer social login (Sign in with Apple or Google)?
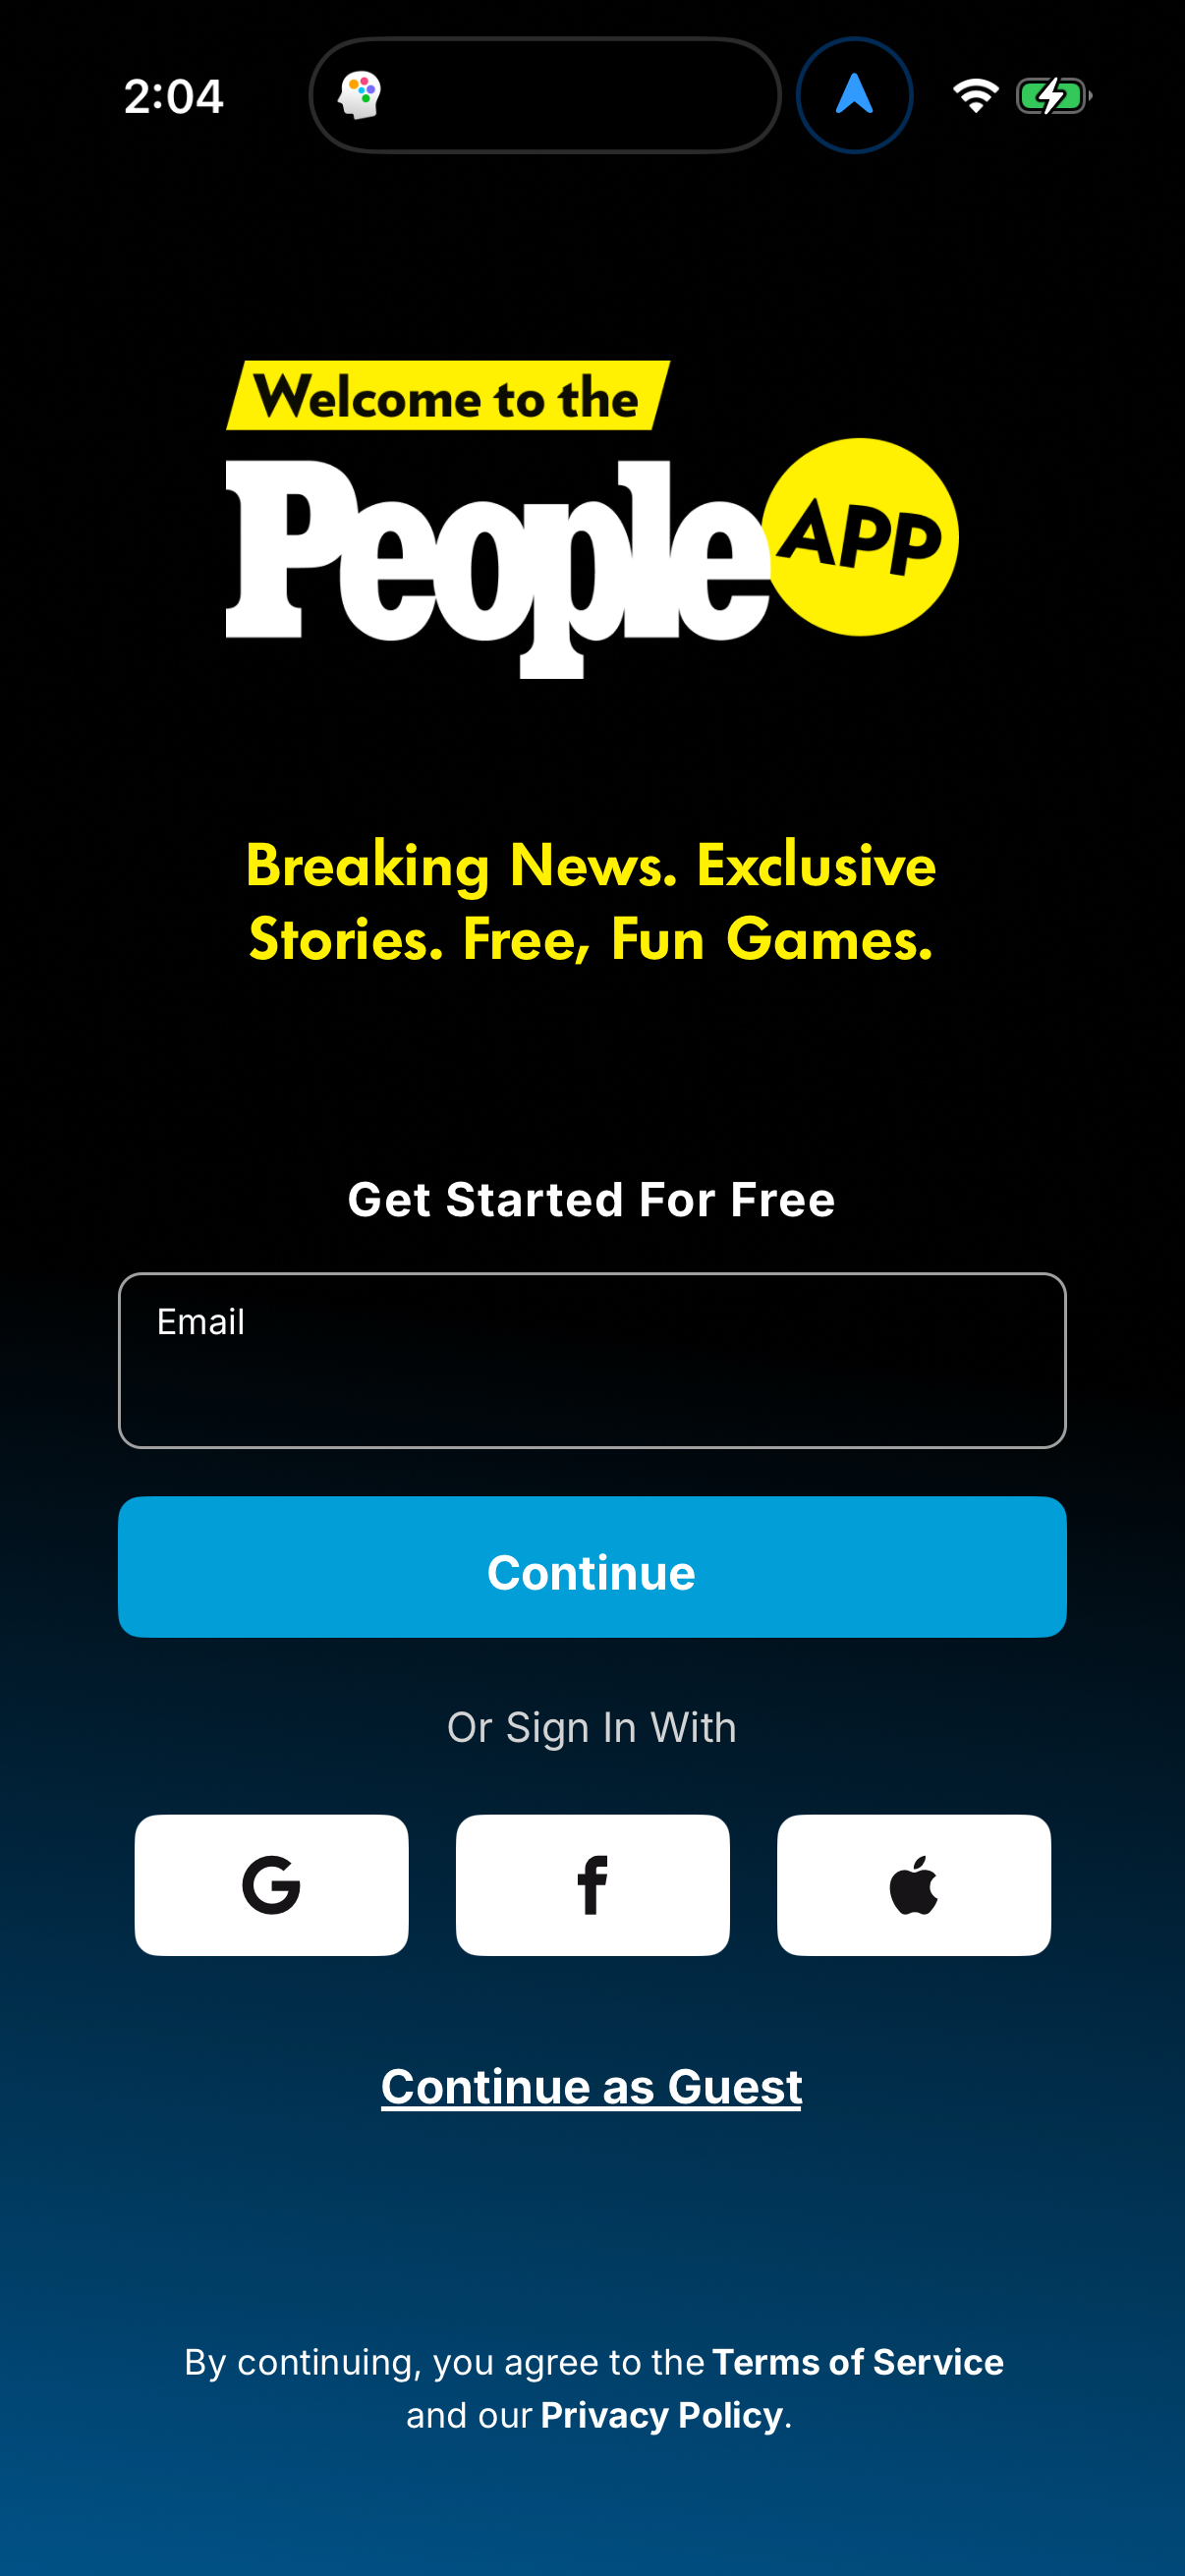
41% of tracked apps offer social login — 329 of 809 show a Sign in with Apple / Google or continue-with option.[1] It's common but far from universal, and prevalence varies by vertical: 63% in Food &…
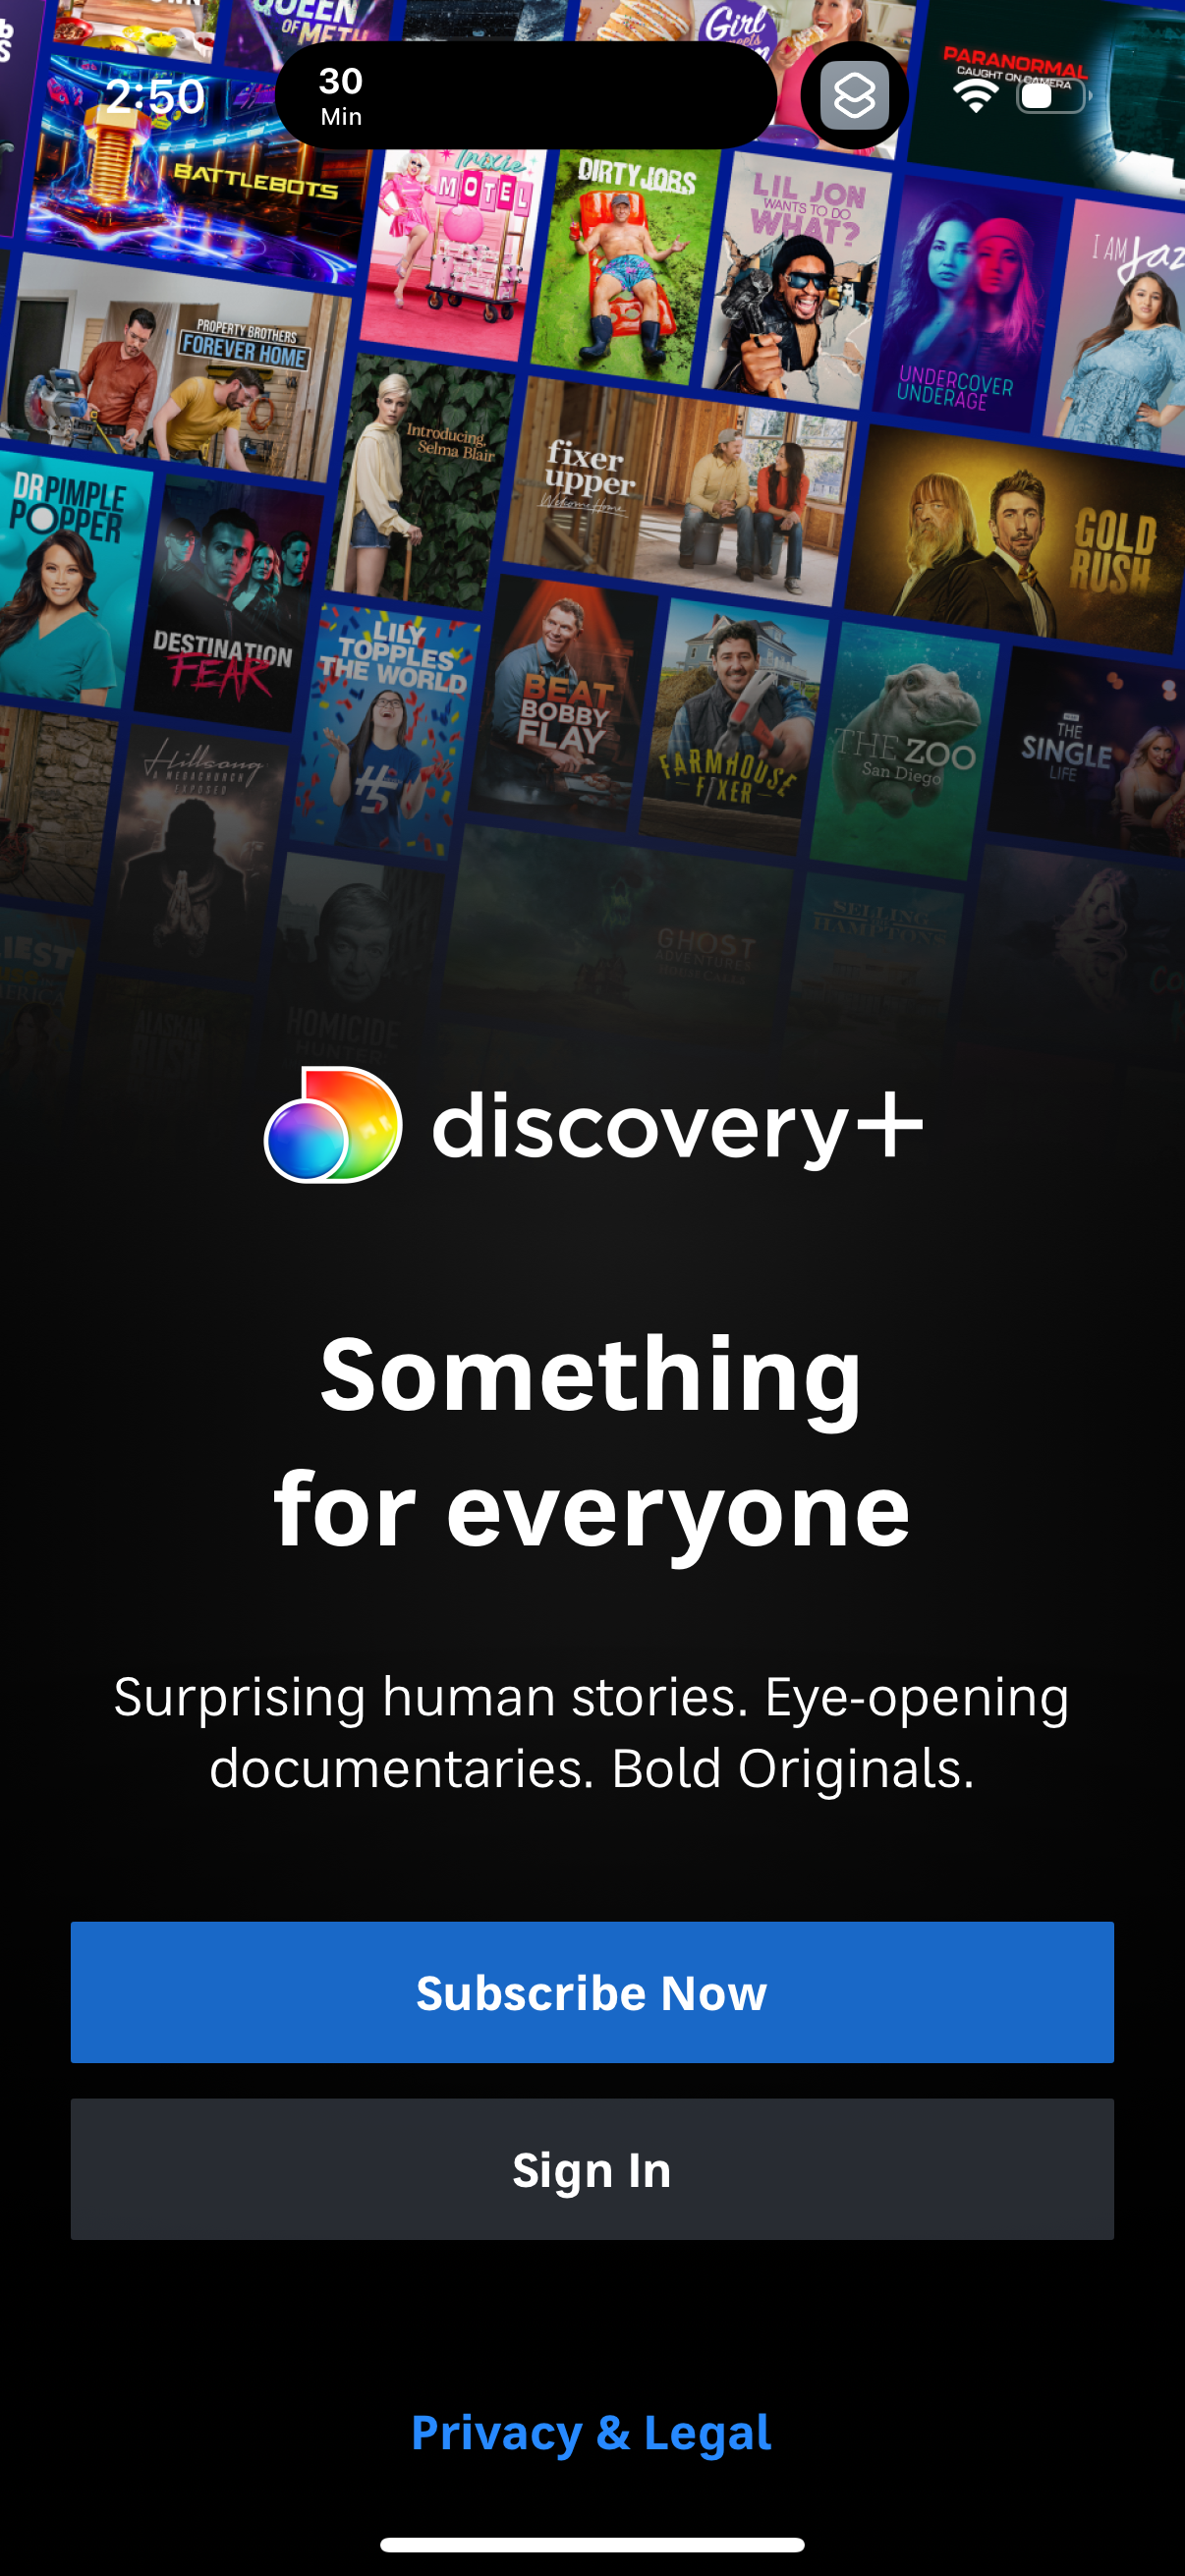
What percentage of mobile apps show a notification permission primer?
40% of tracked apps show a notification permission or priming surface — 323 of 809.[1] That makes the pre-permission primer a common but non-default pattern, roughly tied with social login (41%).[2]…
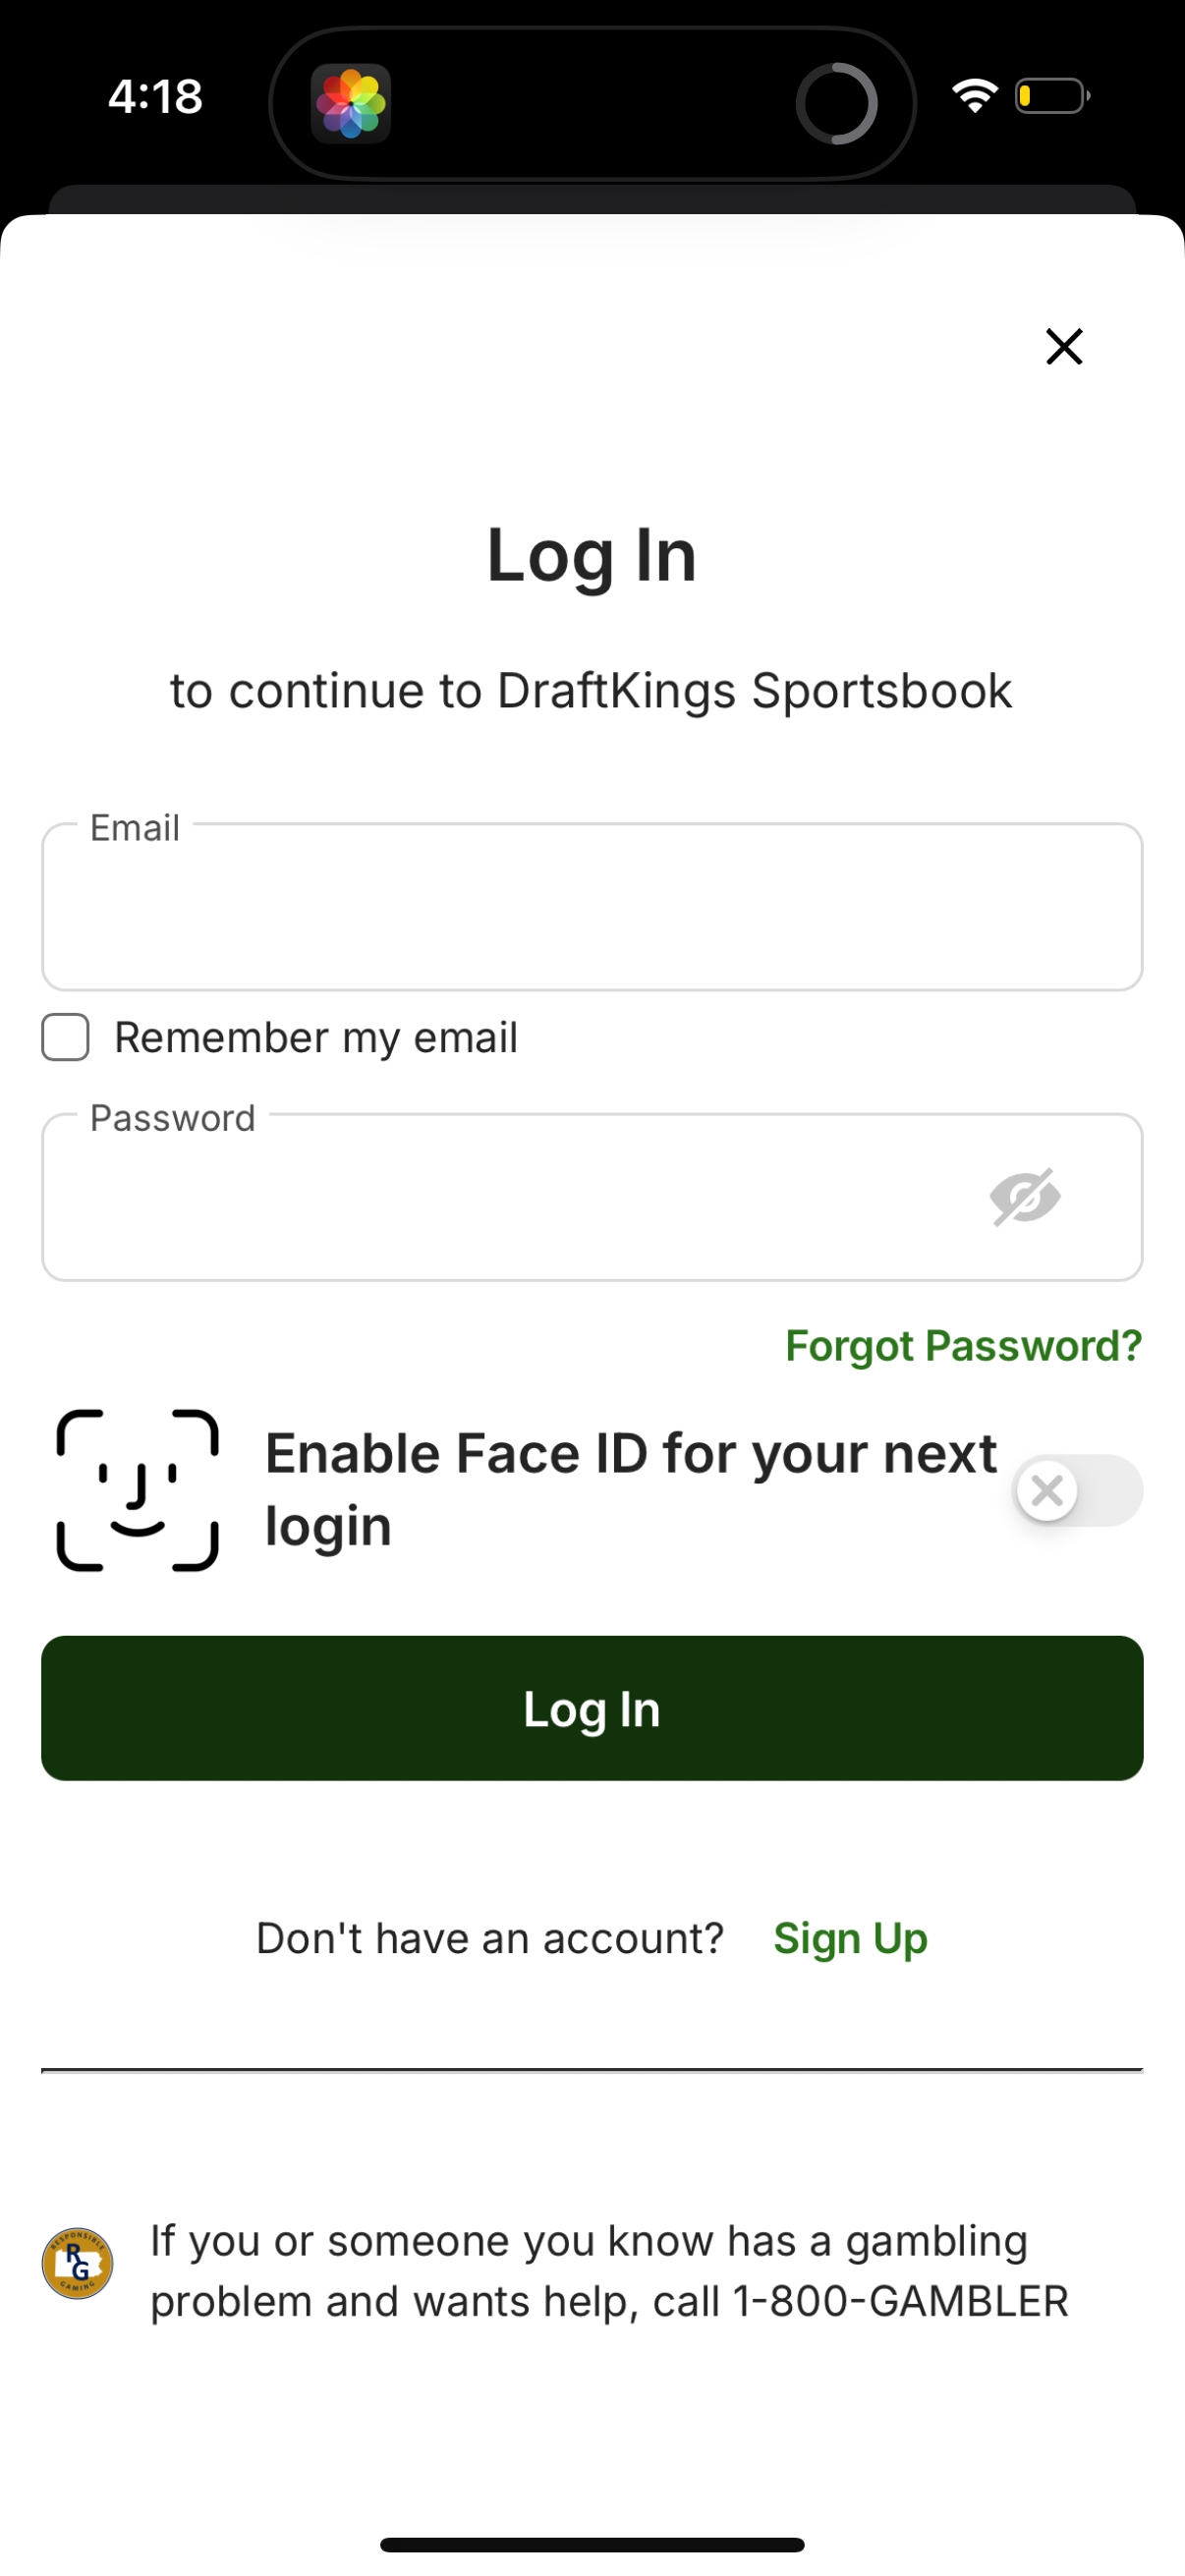
What percentage of mobile apps have a paywall screen?
38% of tracked apps have a paywall or subscription-offer screen — 305 of 809.[1] It's a minority pattern overall, but heavily concentrated by vertical: 76% in Magazines & Newspapers, 68% in both Heal…
What percentage of mobile apps have a checkout or shopping-cart screen?
33% of tracked apps have a checkout or shopping-cart screen — 270 of 809.[1] That makes checkout a minority pattern overall, since most apps monetize through subscriptions or aren't commerce at all.[…
What percentage of mobile apps show an in-flow upsell or order bump?
Up to 46% of tracked apps show an in-flow upsell or order-bump surface — 374 of 809 — but this is a deliberate upper bound.[1] The broad match catches both checkout order-bumps and subscription upsel…
How common are streak screens outside of Duolingo?
Only 12% of tracked apps have a streak screen — 94 of 809 — so streaks are far from universal.[1] But they aren't a Duolingo one-off either: they're concentrated in Health & Fitness (50%) and Educati…
Which app categories actually use streak screens?
Streaks are essentially a two-category pattern: 50% of Health & Fitness apps (28 of 56) and 51% of Education apps (19 of 37) have a streak screen, versus 2% in Finance, News, and Travel.[1] Overall o…
How many of the ~800 tracked apps have a visible referral or invite-friends program?
25% of tracked apps have a visible referral or invite-friends surface — 205 of 809.[1] It's a minority pattern overall, but a coin-flip in the categories that fit it: 50% in both Social Networking an…
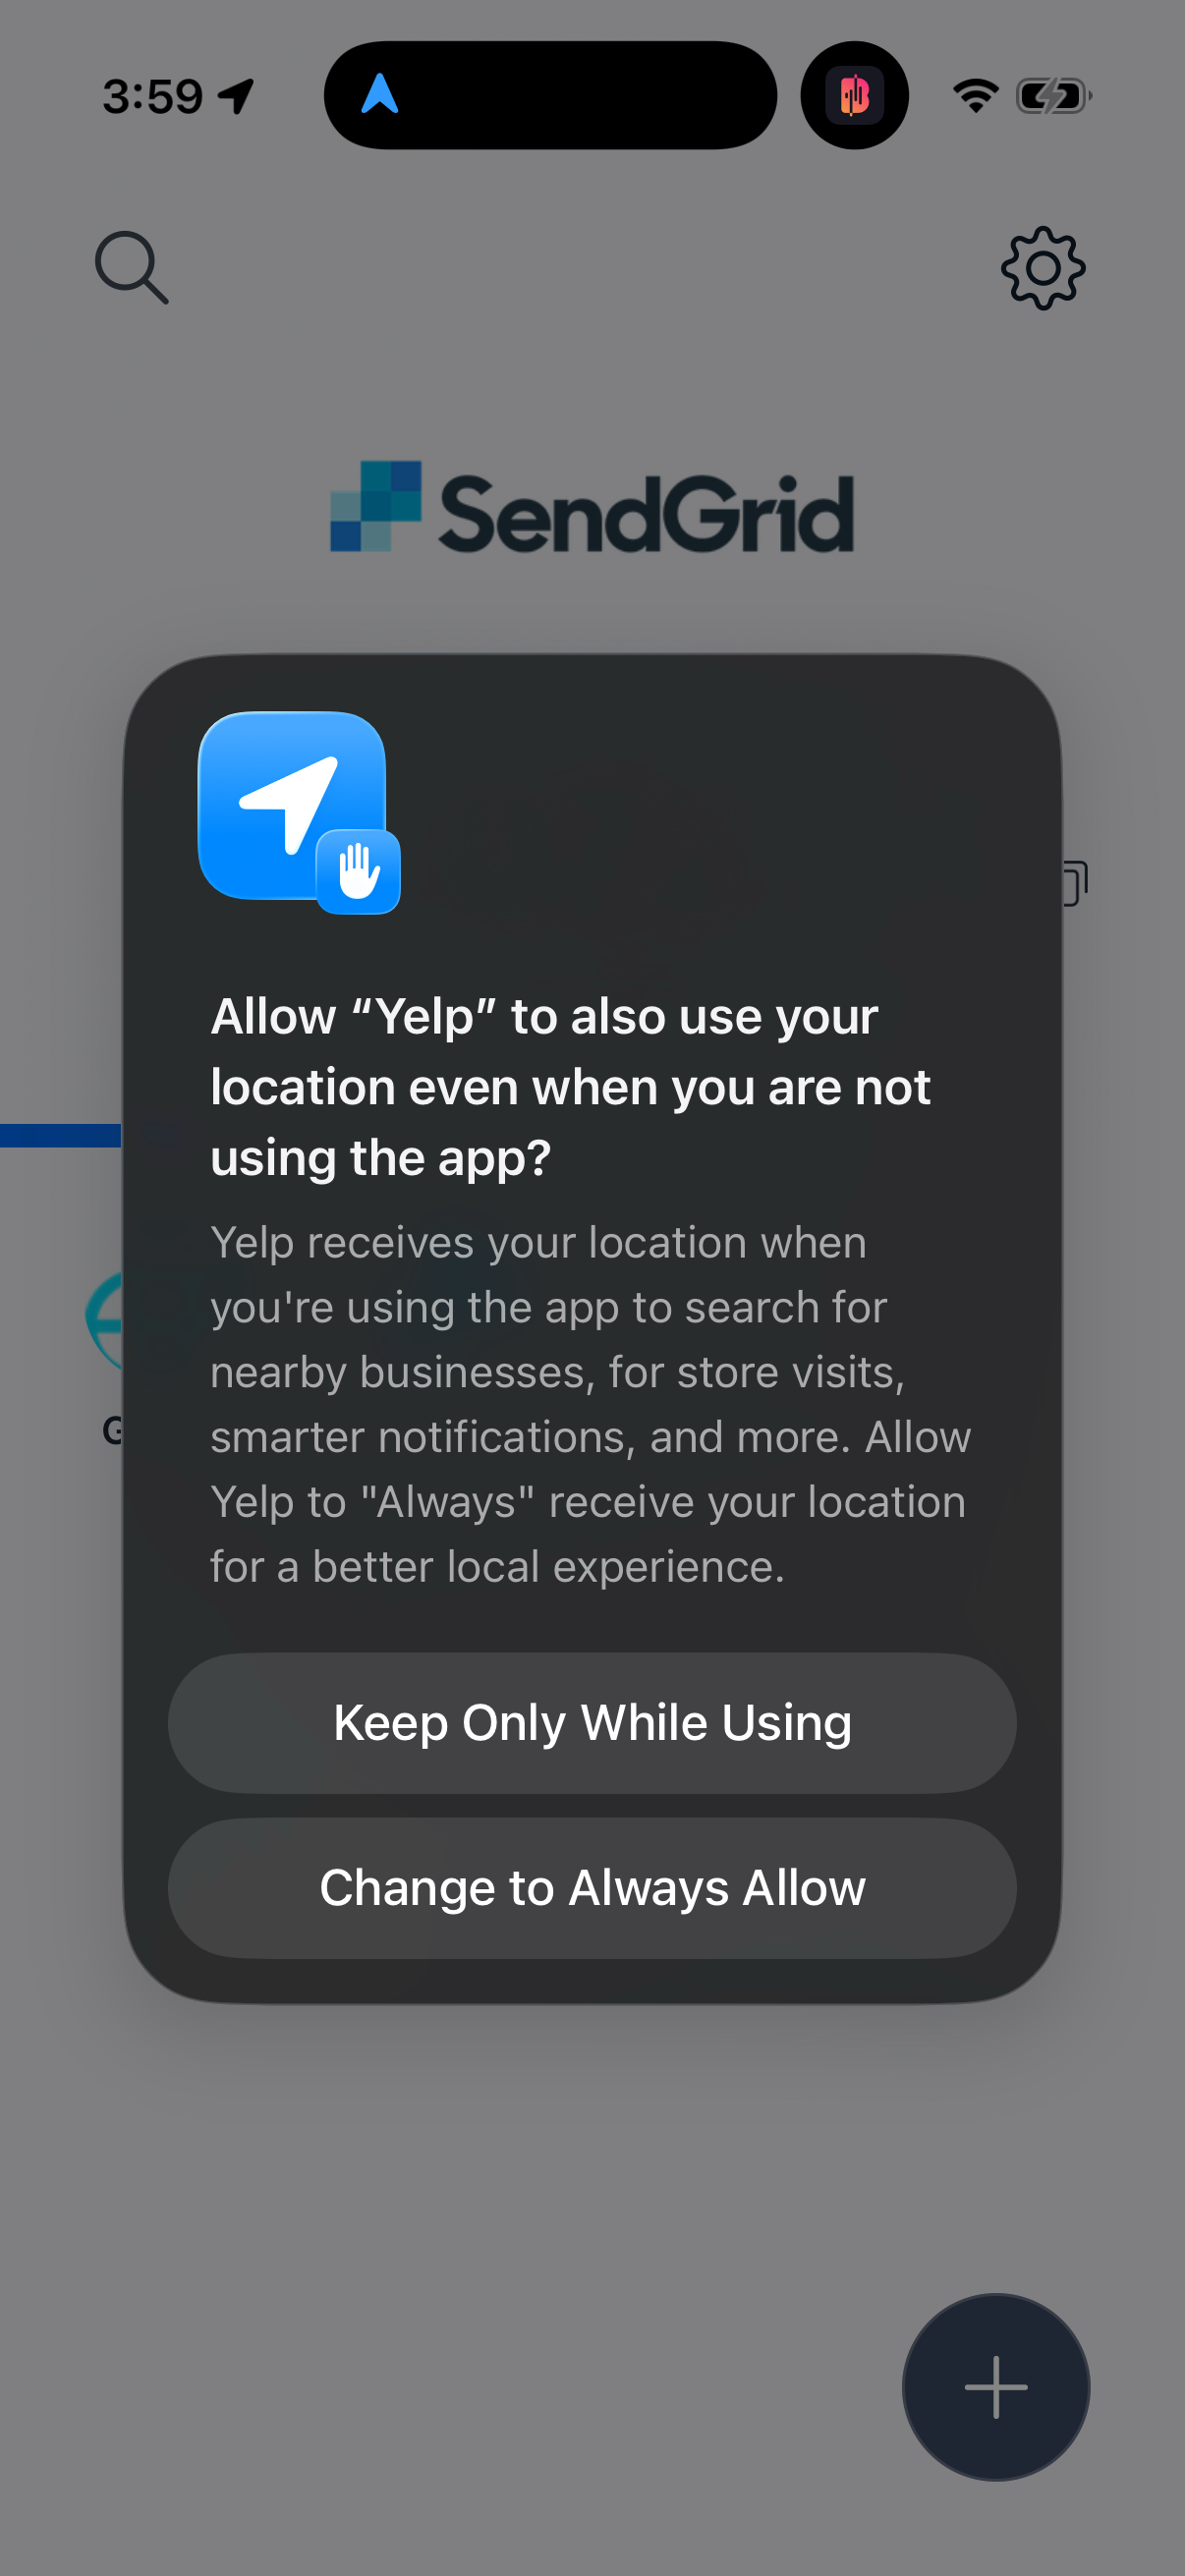
Which app categories are most likely to have a referral program?
Referral density peaks in Social Networking and Health & Fitness at 50% each (20/40 and 28/56), followed by Travel at 42% (17/41).[1] The floor is News at 13% (6/46) and Productivity at 16% (10/64).[…
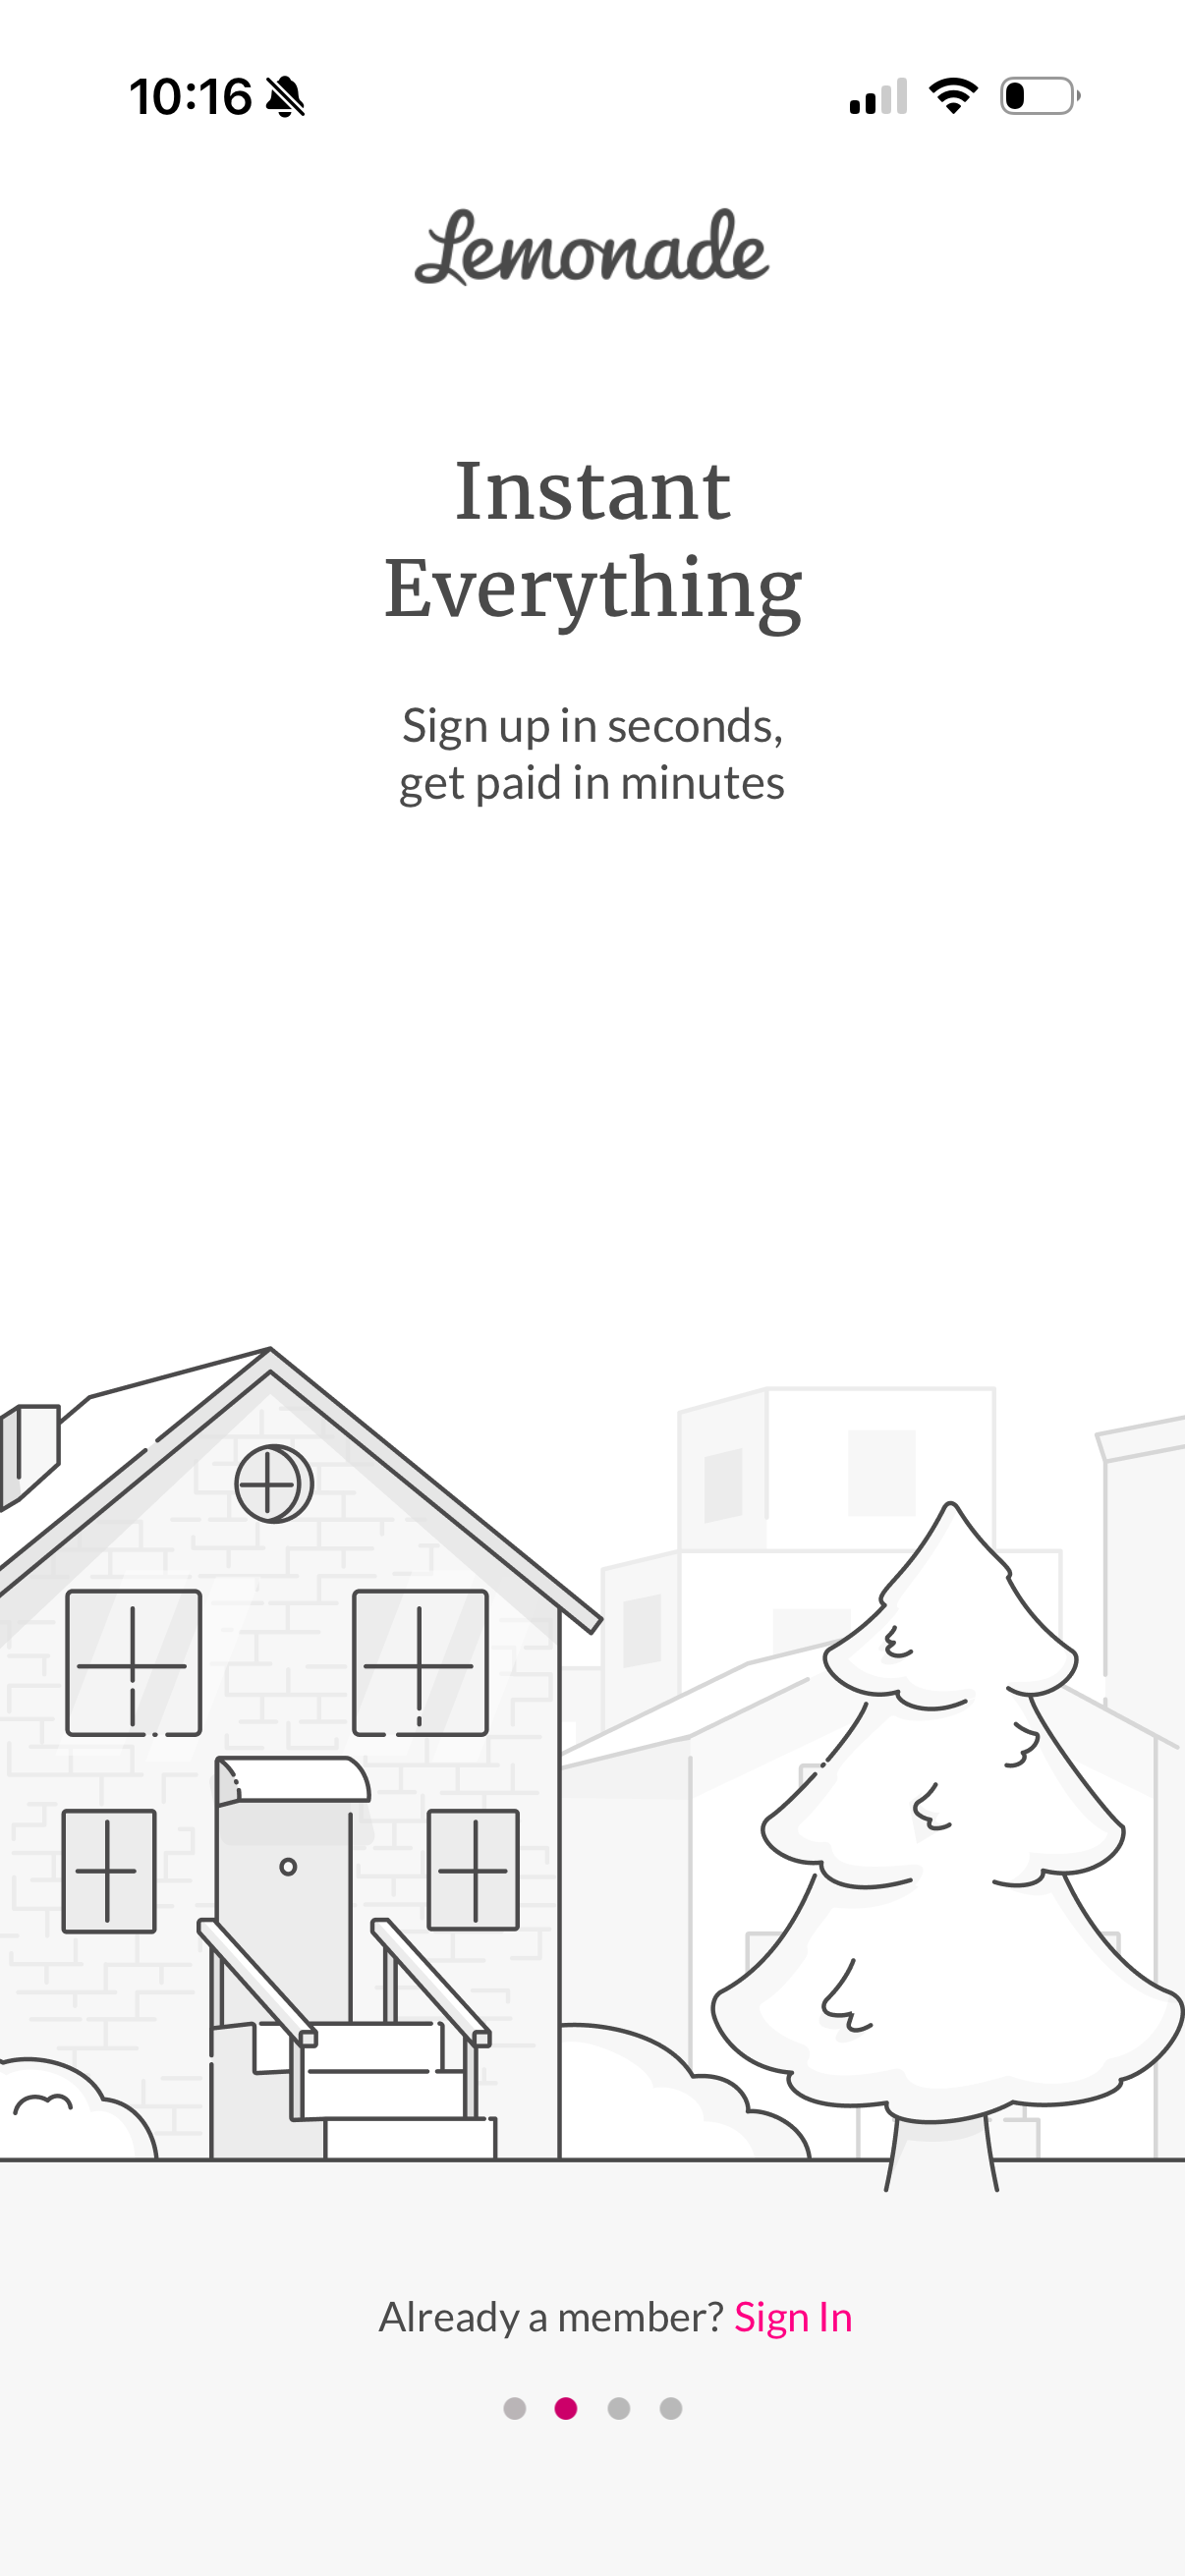
What percent of mobile apps show a notification permission primer screen?
39.9% of tracked apps (323 of 809) show a notification permission or priming surface [1]. That makes the notification primer a majority-of-the-serious-onboarders pattern but not universal: roughly 3…
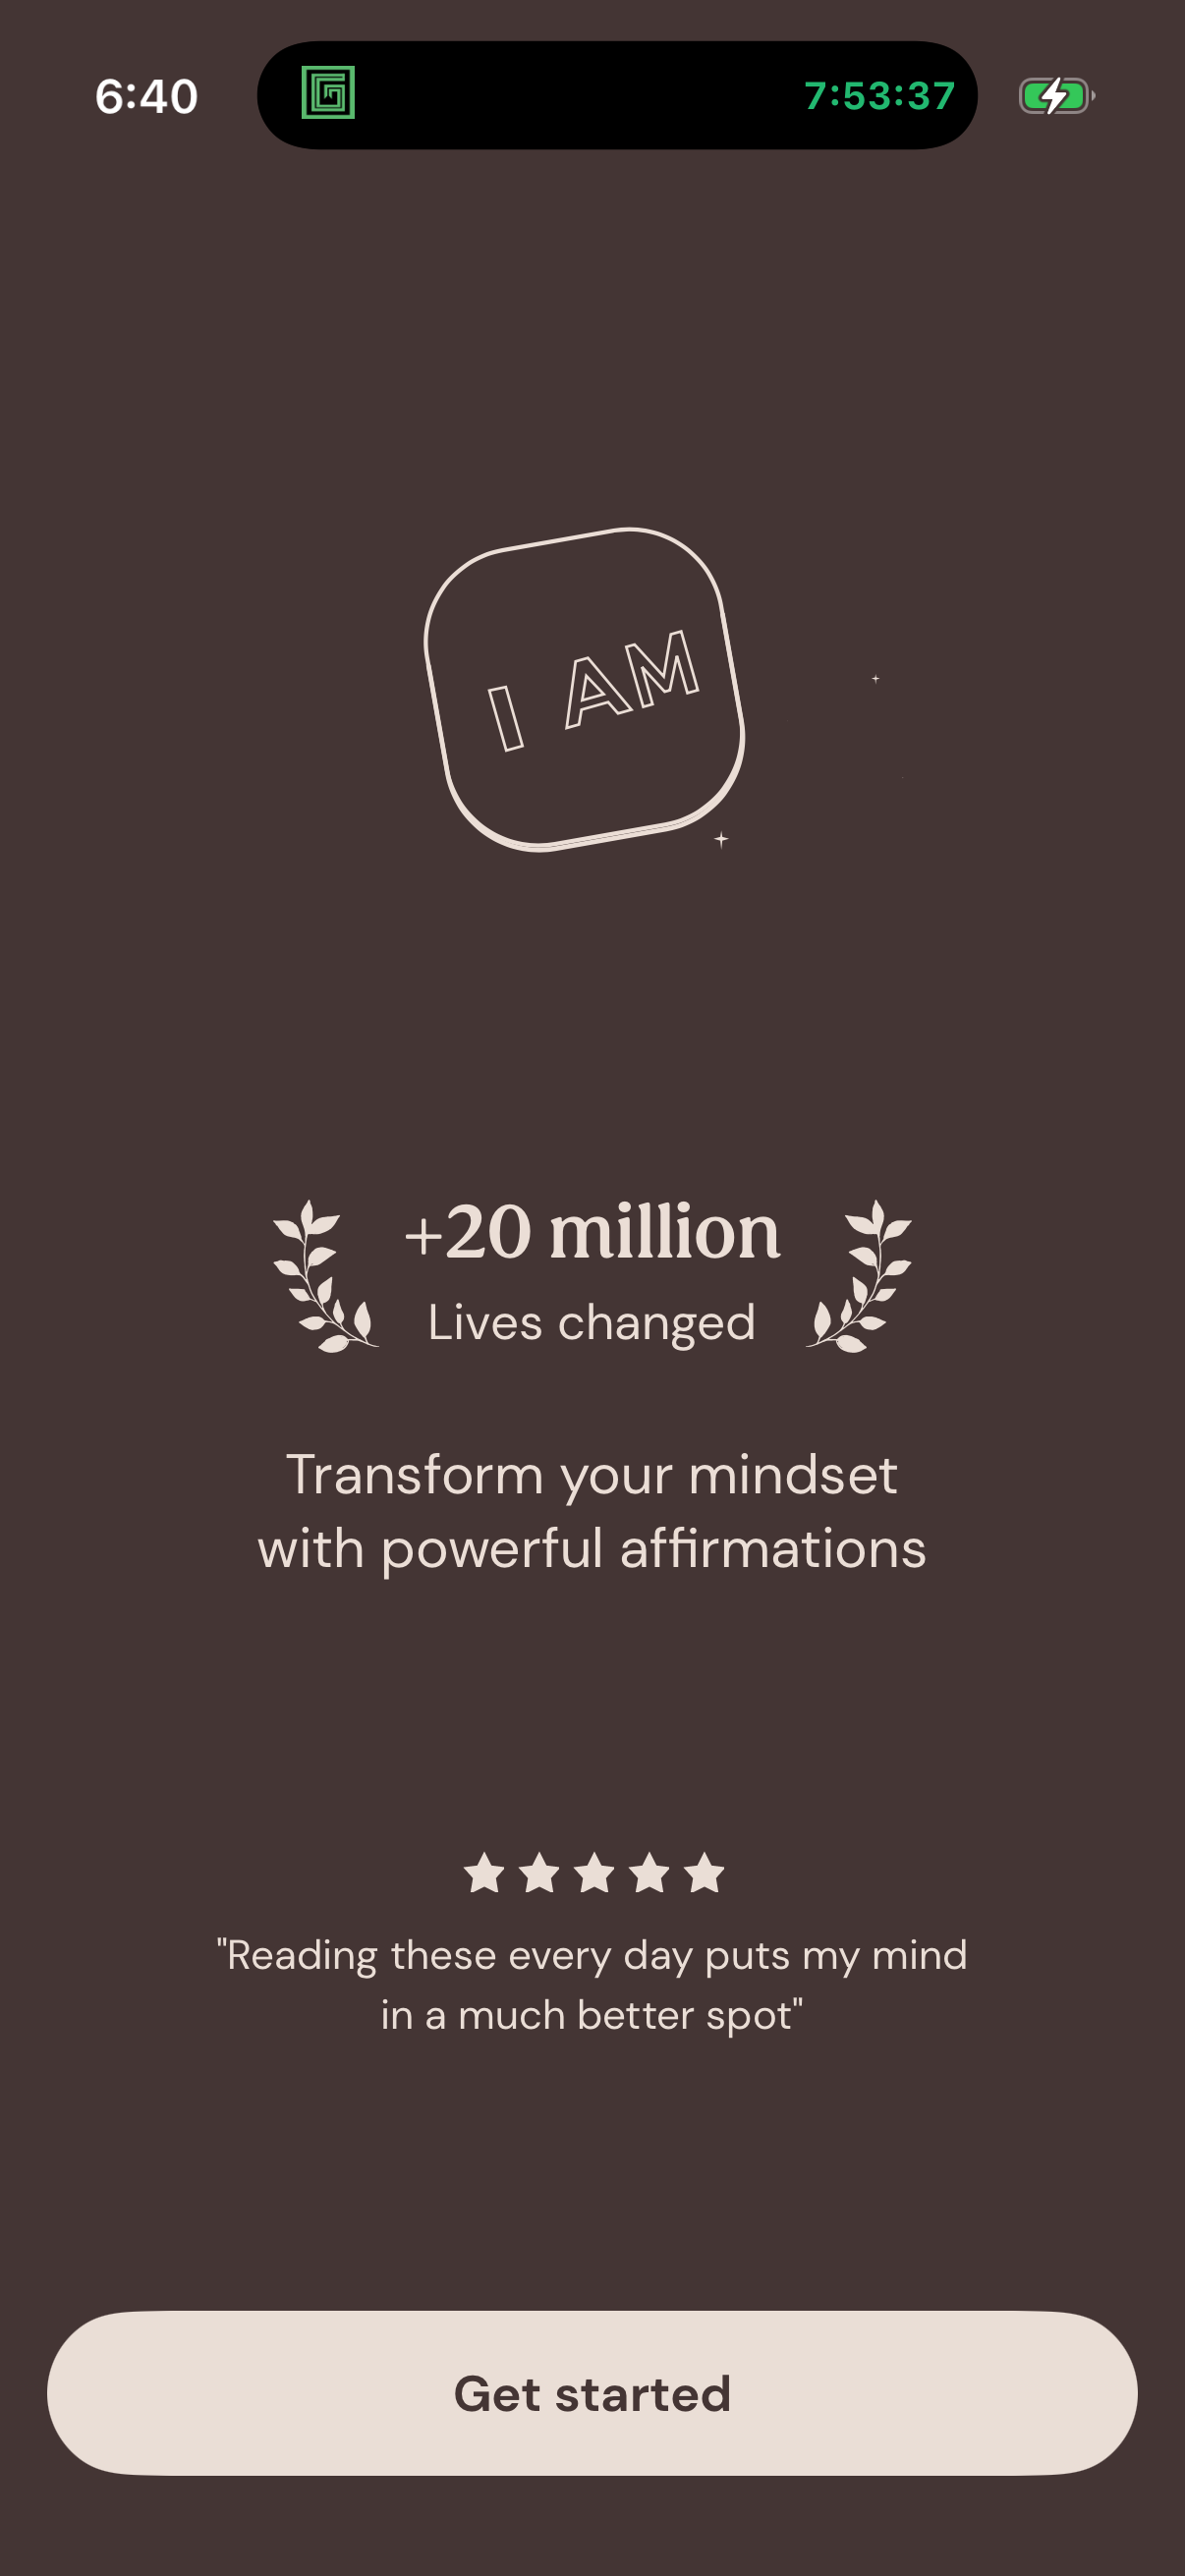
What percent of mobile apps offer social login (Sign in with Apple or Google)?
40.7% of tracked apps (329 of 809) offer a Sign in with Apple / Google or continue-with social login [1]. So social login is a plurality pattern, present in roughly 2 in 5 tracked apps — common enoug…
What percent of mobile apps have a paywall or subscription-offer screen?
37.7% of tracked apps (305 of 809) have a captured paywall or subscription-offer screen [1]. So a little over 1 in 3 tracked apps show a paywall — but the average hides huge vertical spread: 68% of H…
Which app categories are most and least likely to have a paywall screen?
Health & Fitness and Education lead at 68% of apps with a captured paywall (38 of 56 and 25 of 37), while Shopping trails at 9% (4 of 44) [1]. The gap between the most and least paywalled verticals i…
What percent of mobile apps have a settings screen?
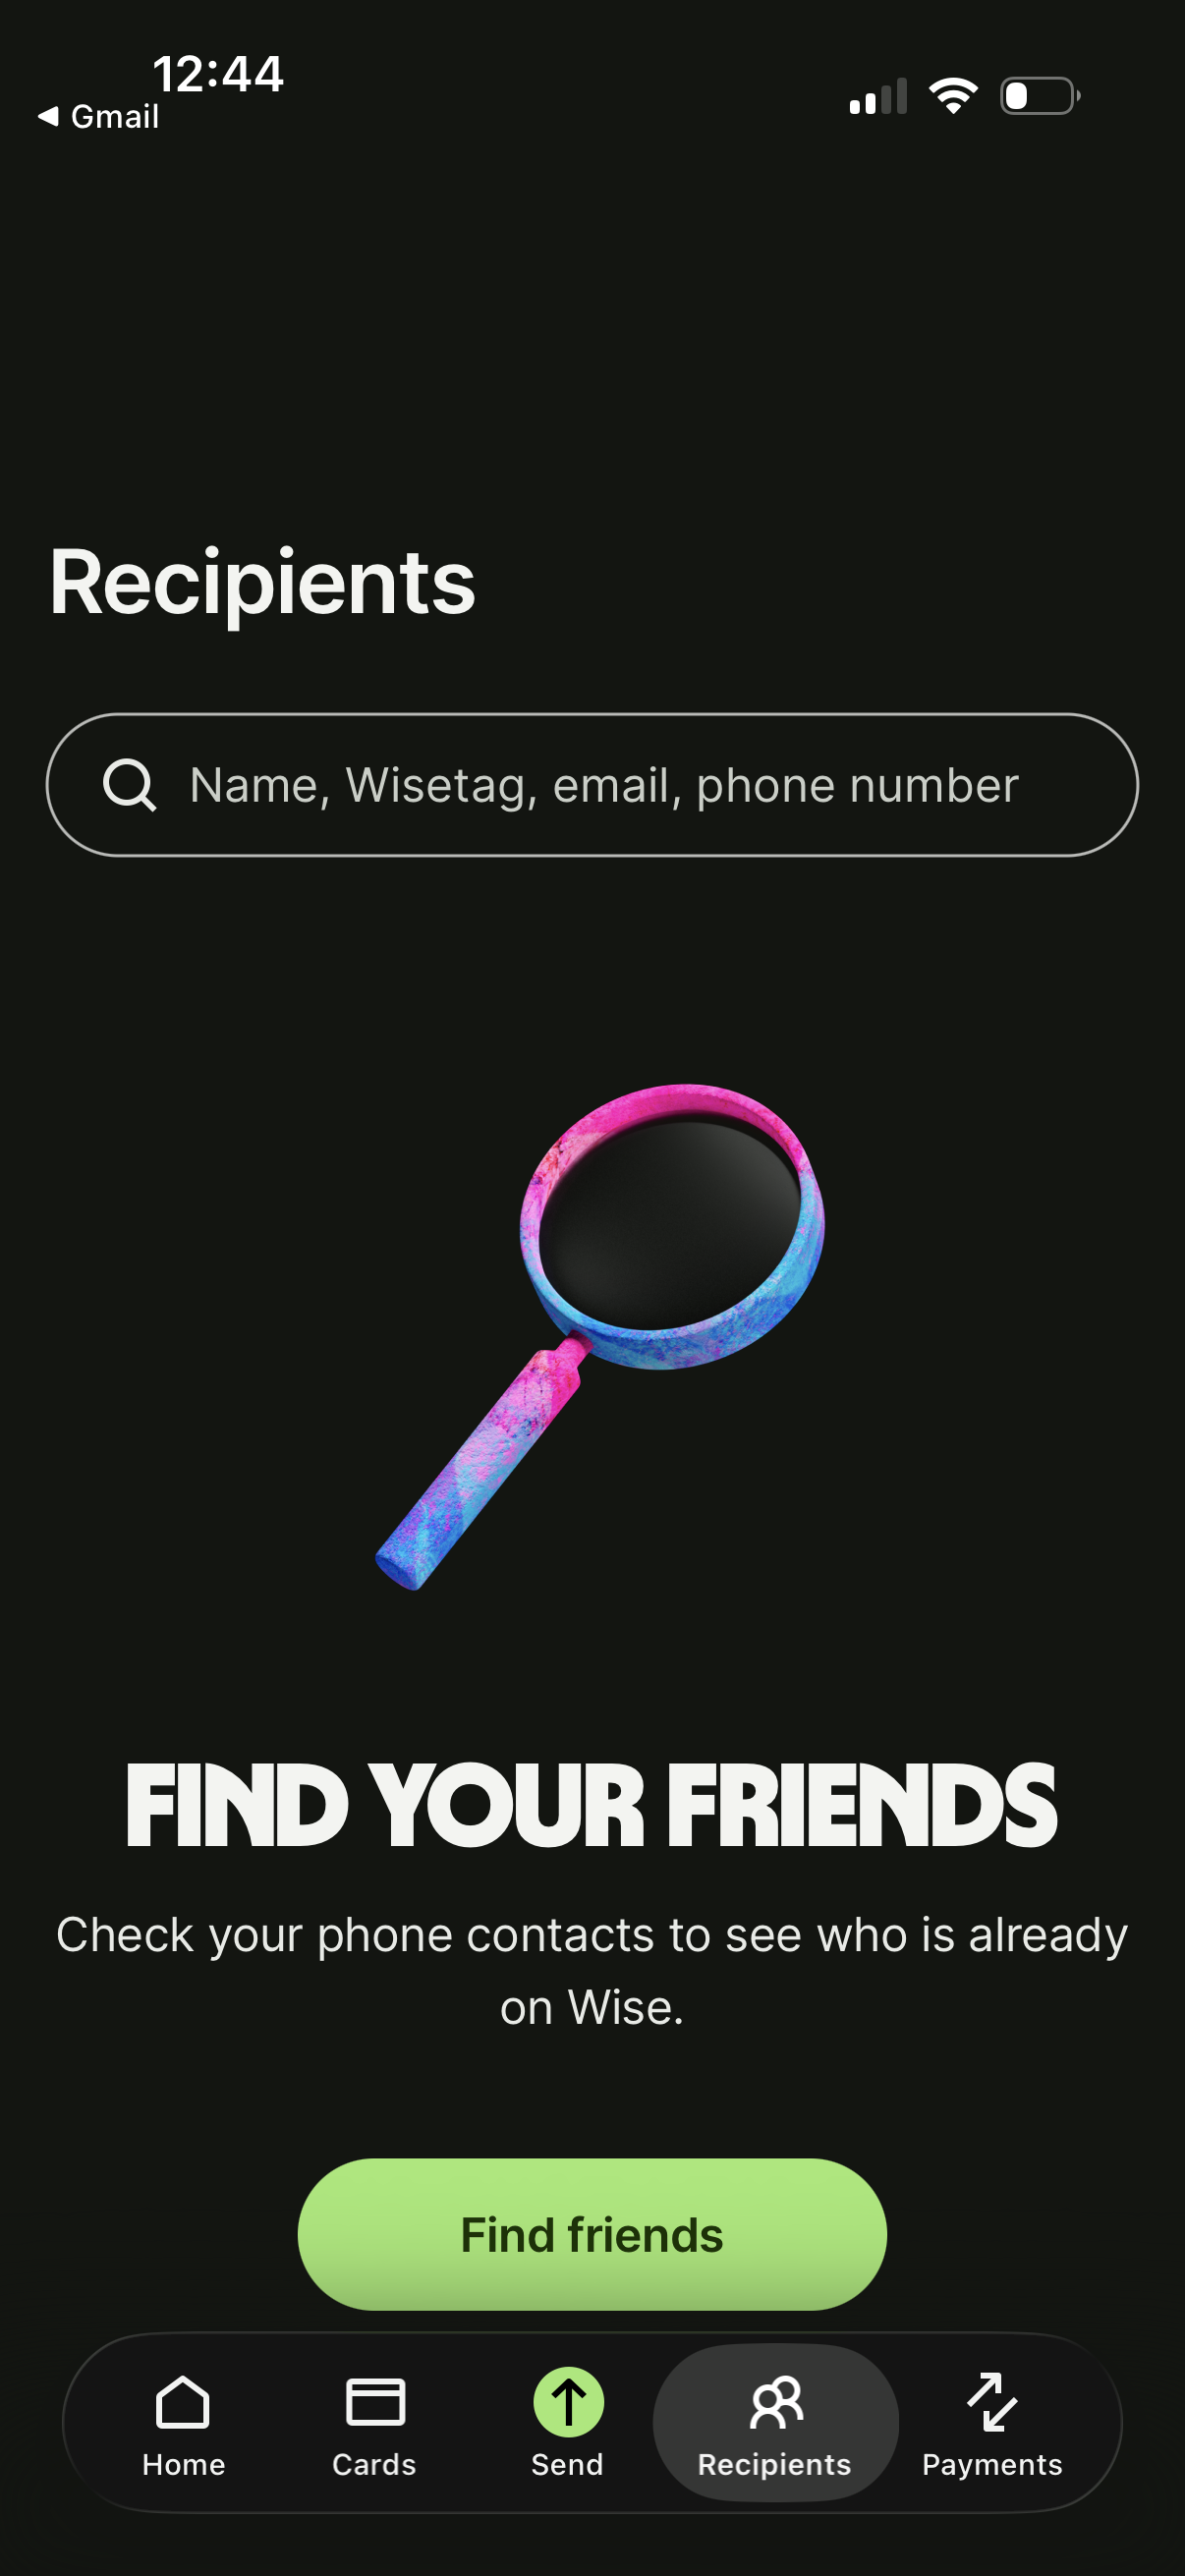
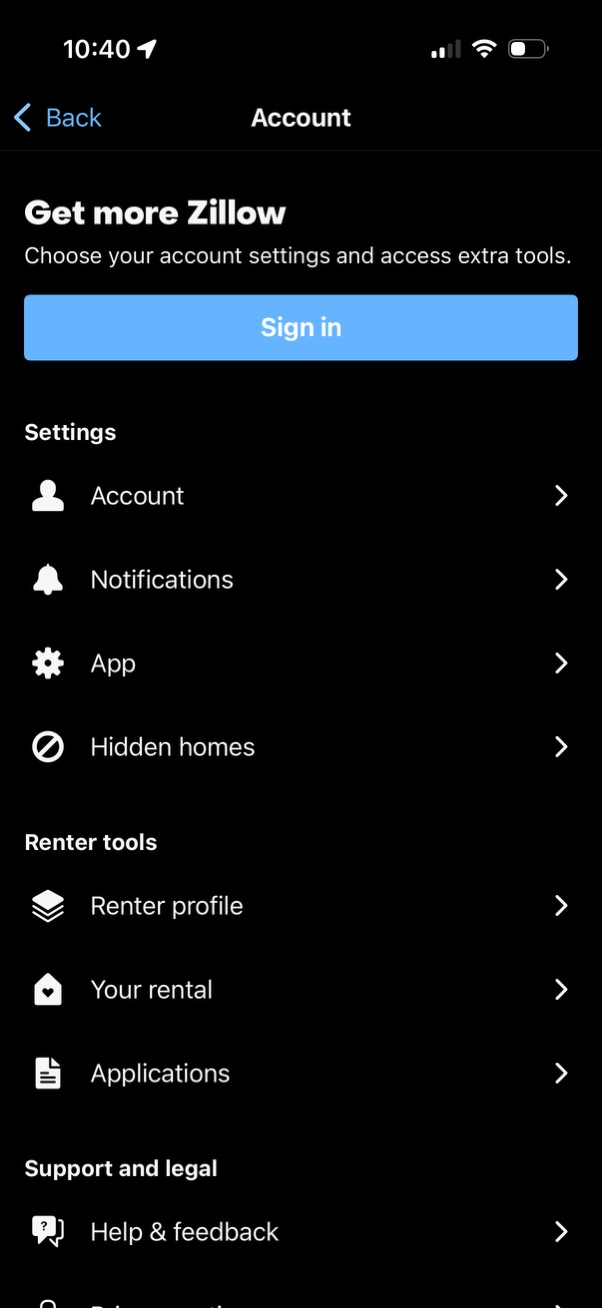
71.4% of tracked apps (578 of 809) have a captured settings screen — the most universal non-home screen in the corpus [1]. Even so, it is not literally everywhere: ~29% of tracked apps have no captur…
What percent of mobile apps have a dedicated empty-state screen?
45.7% of tracked apps (370 of 809) have a captured empty-state screen [1]. So a purpose-built empty state is close to a coin flip: slightly under half of tracked apps invest in one. Given empty state…
What percent of mobile apps have a dark-mode or theme toggle?
19.0% of tracked apps (154 of 809) have a captured dark-mode or theme-toggle surface [1]. So an explicit in-app dark-mode toggle is a minority pattern — under 1 in 5 tracked apps — which mostly refle…
What percent of mobile apps have biometric or passkey login?
16.6% of tracked apps (134 of 809) have a captured biometric or passkey login surface — Face ID, Touch ID, fingerprint, or passkey [1]. So biometric login is a minority pattern, roughly 1 in 6 tracke…
What percent of mobile apps show an onboarding quiz or personalization questions?
13.3% of tracked apps (108 of 809) show an onboarding quiz or personalization-question surface [1]. So the quiz-style onboarding popularized by wellness and language apps is still a minority pattern…
What percent of mobile apps have a celebration, success, or confetti moment?
11.9% of tracked apps (96 of 809) have a captured celebration, success, or confetti moment [1]. So the dopamine-hit success screen is a minority pattern — about 1 in 8 tracked apps — concentrated in…
What percent of mobile apps have an AI assistant or chatbot screen?
10.9% of tracked apps (88 of 809) have a captured AI assistant, chatbot, or ask-AI surface [1]. So despite the AI wave, a visible in-app AI assistant is still a minority pattern as of July 2026 — abo…
What percent of mobile apps have a leaderboard or ranking screen?
6.8% of tracked apps (55 of 809) have a captured leaderboard or ranking surface [1]. So leaderboards are a rare, niche gamification pattern — under 1 in 14 tracked apps — even rarer than streaks (11.…
What percent of mobile apps have a checkout or shopping-cart screen?
33.4% of tracked apps (270 of 809) have a captured checkout or shopping-cart screen [1]. So a transactional checkout is a minority-to-third pattern overall — about 1 in 3 tracked apps — because most…
What percent of mobile apps have an in-flow upsell or order-bump surface?
At most 46.2% of tracked apps (374 of 809) show an in-flow upsell or order-bump surface — but this is a deliberate upper bound [1]. The tag match catches both checkout order-bumps and subscription up…
What percent of mobile apps have a cancel-subscription screen?
7.8% of tracked apps (63 of 809) have a captured cancel-subscription surface [1]. That low figure mostly reflects capture, not reality: cancel flows are hard to reach in screenshotting, and the canon…
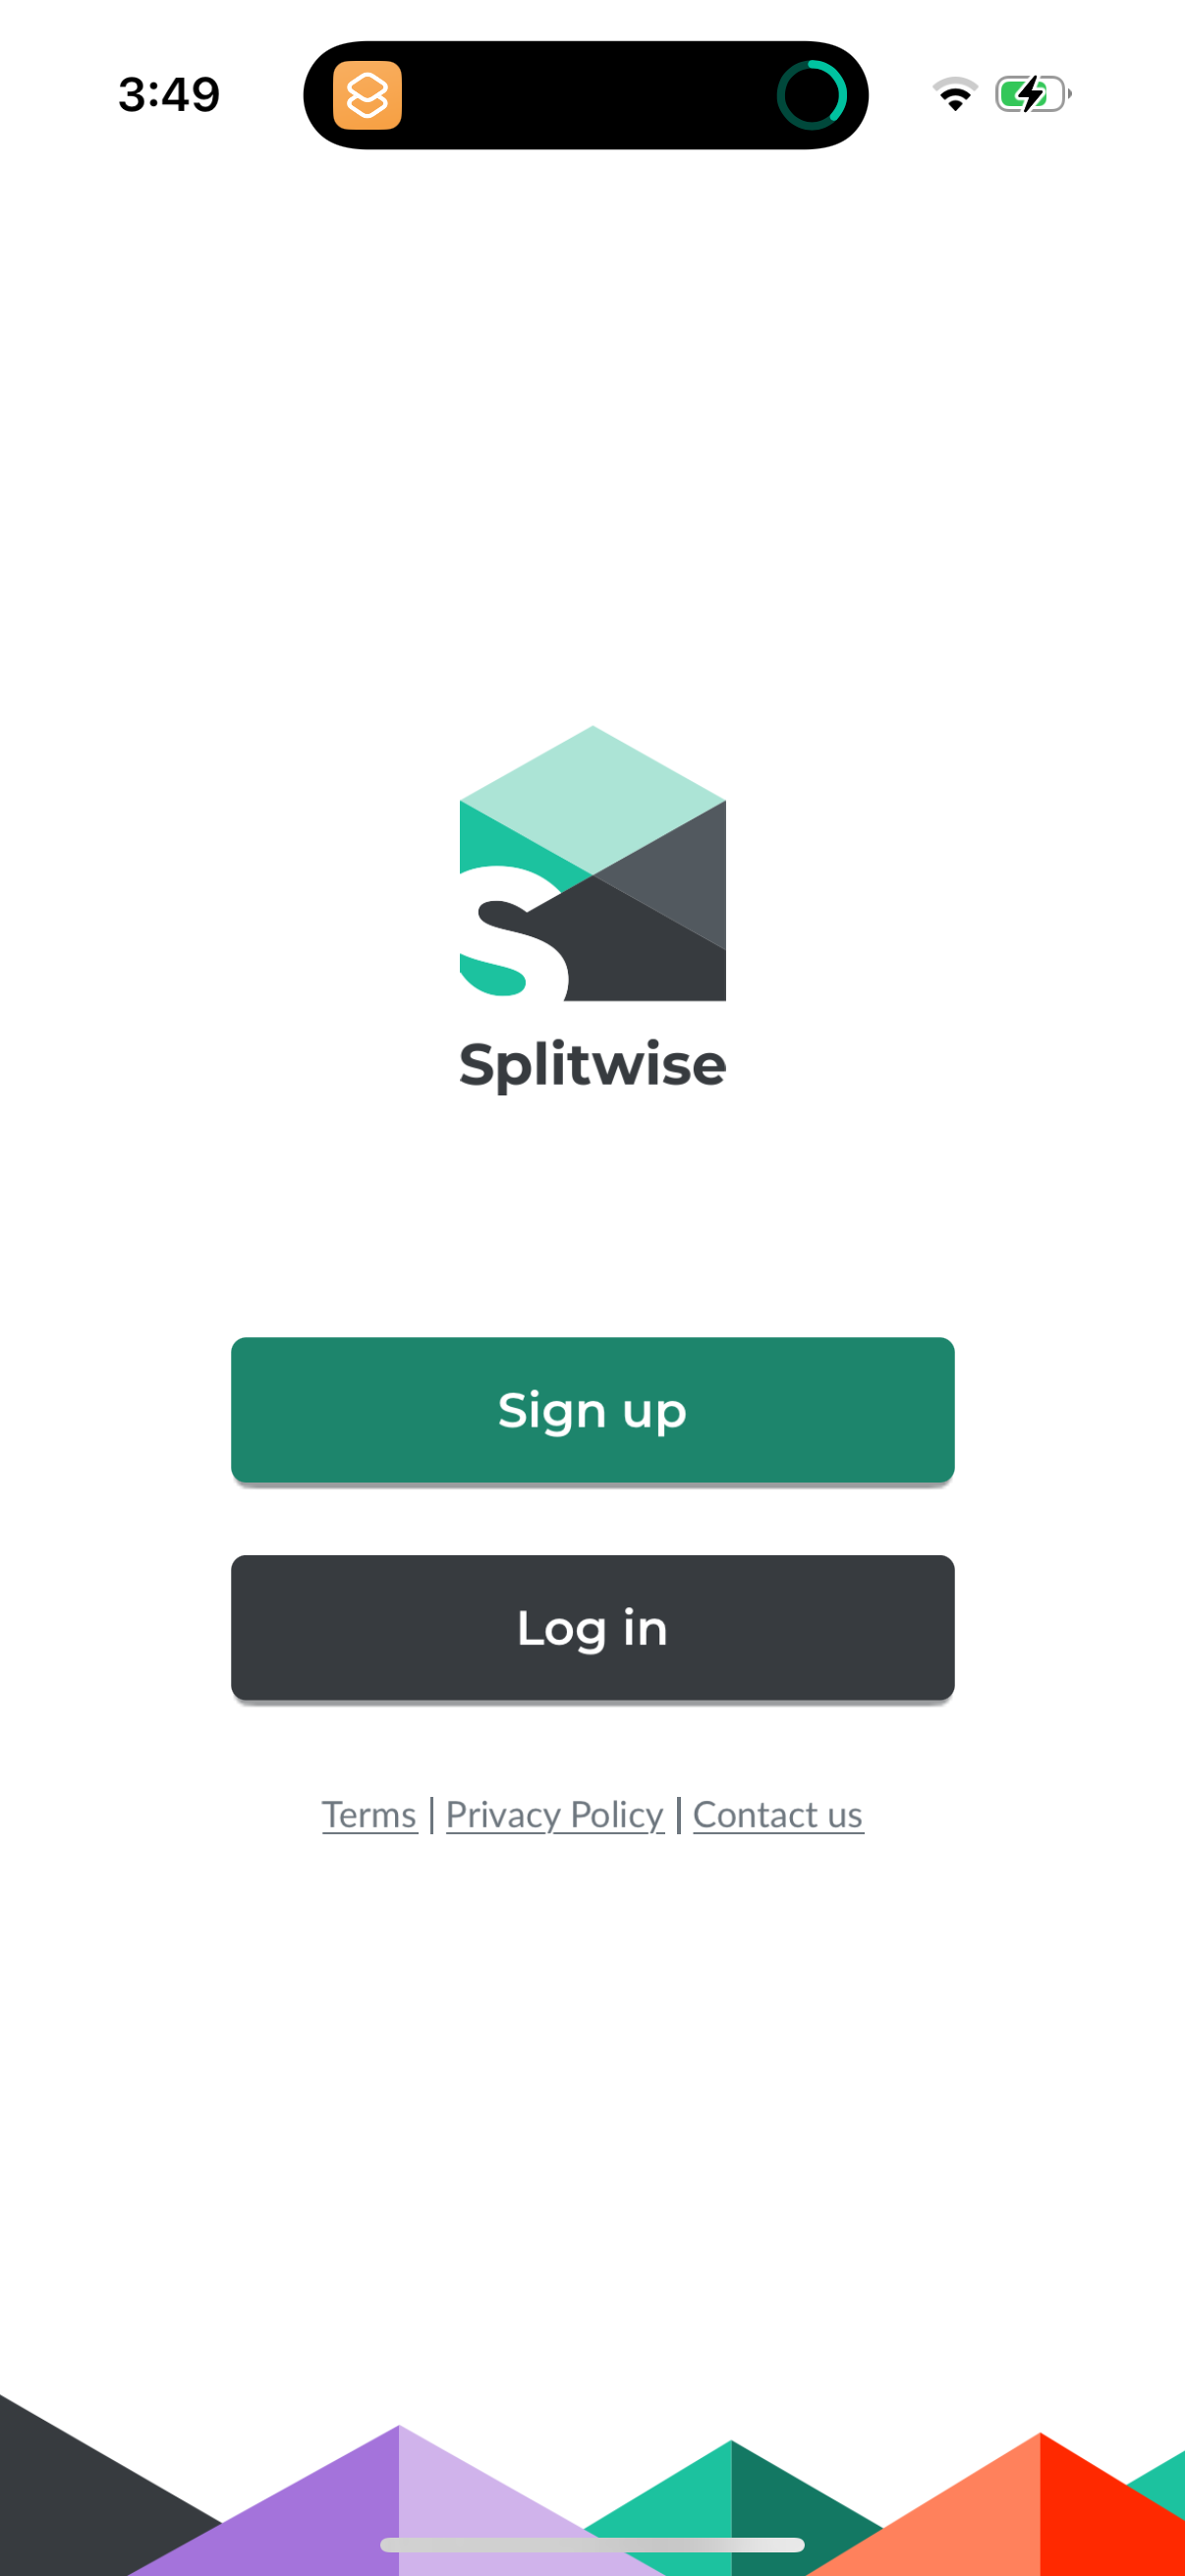
How common are account-setup and login screens across mobile apps?
298 canonical account-setup screens sit in the corpus, with account-login present in 158 apps and dedicated sign-up screens in 82 apps [1]. At the app level, 58.0% of tracked apps (469 of 809) have a…
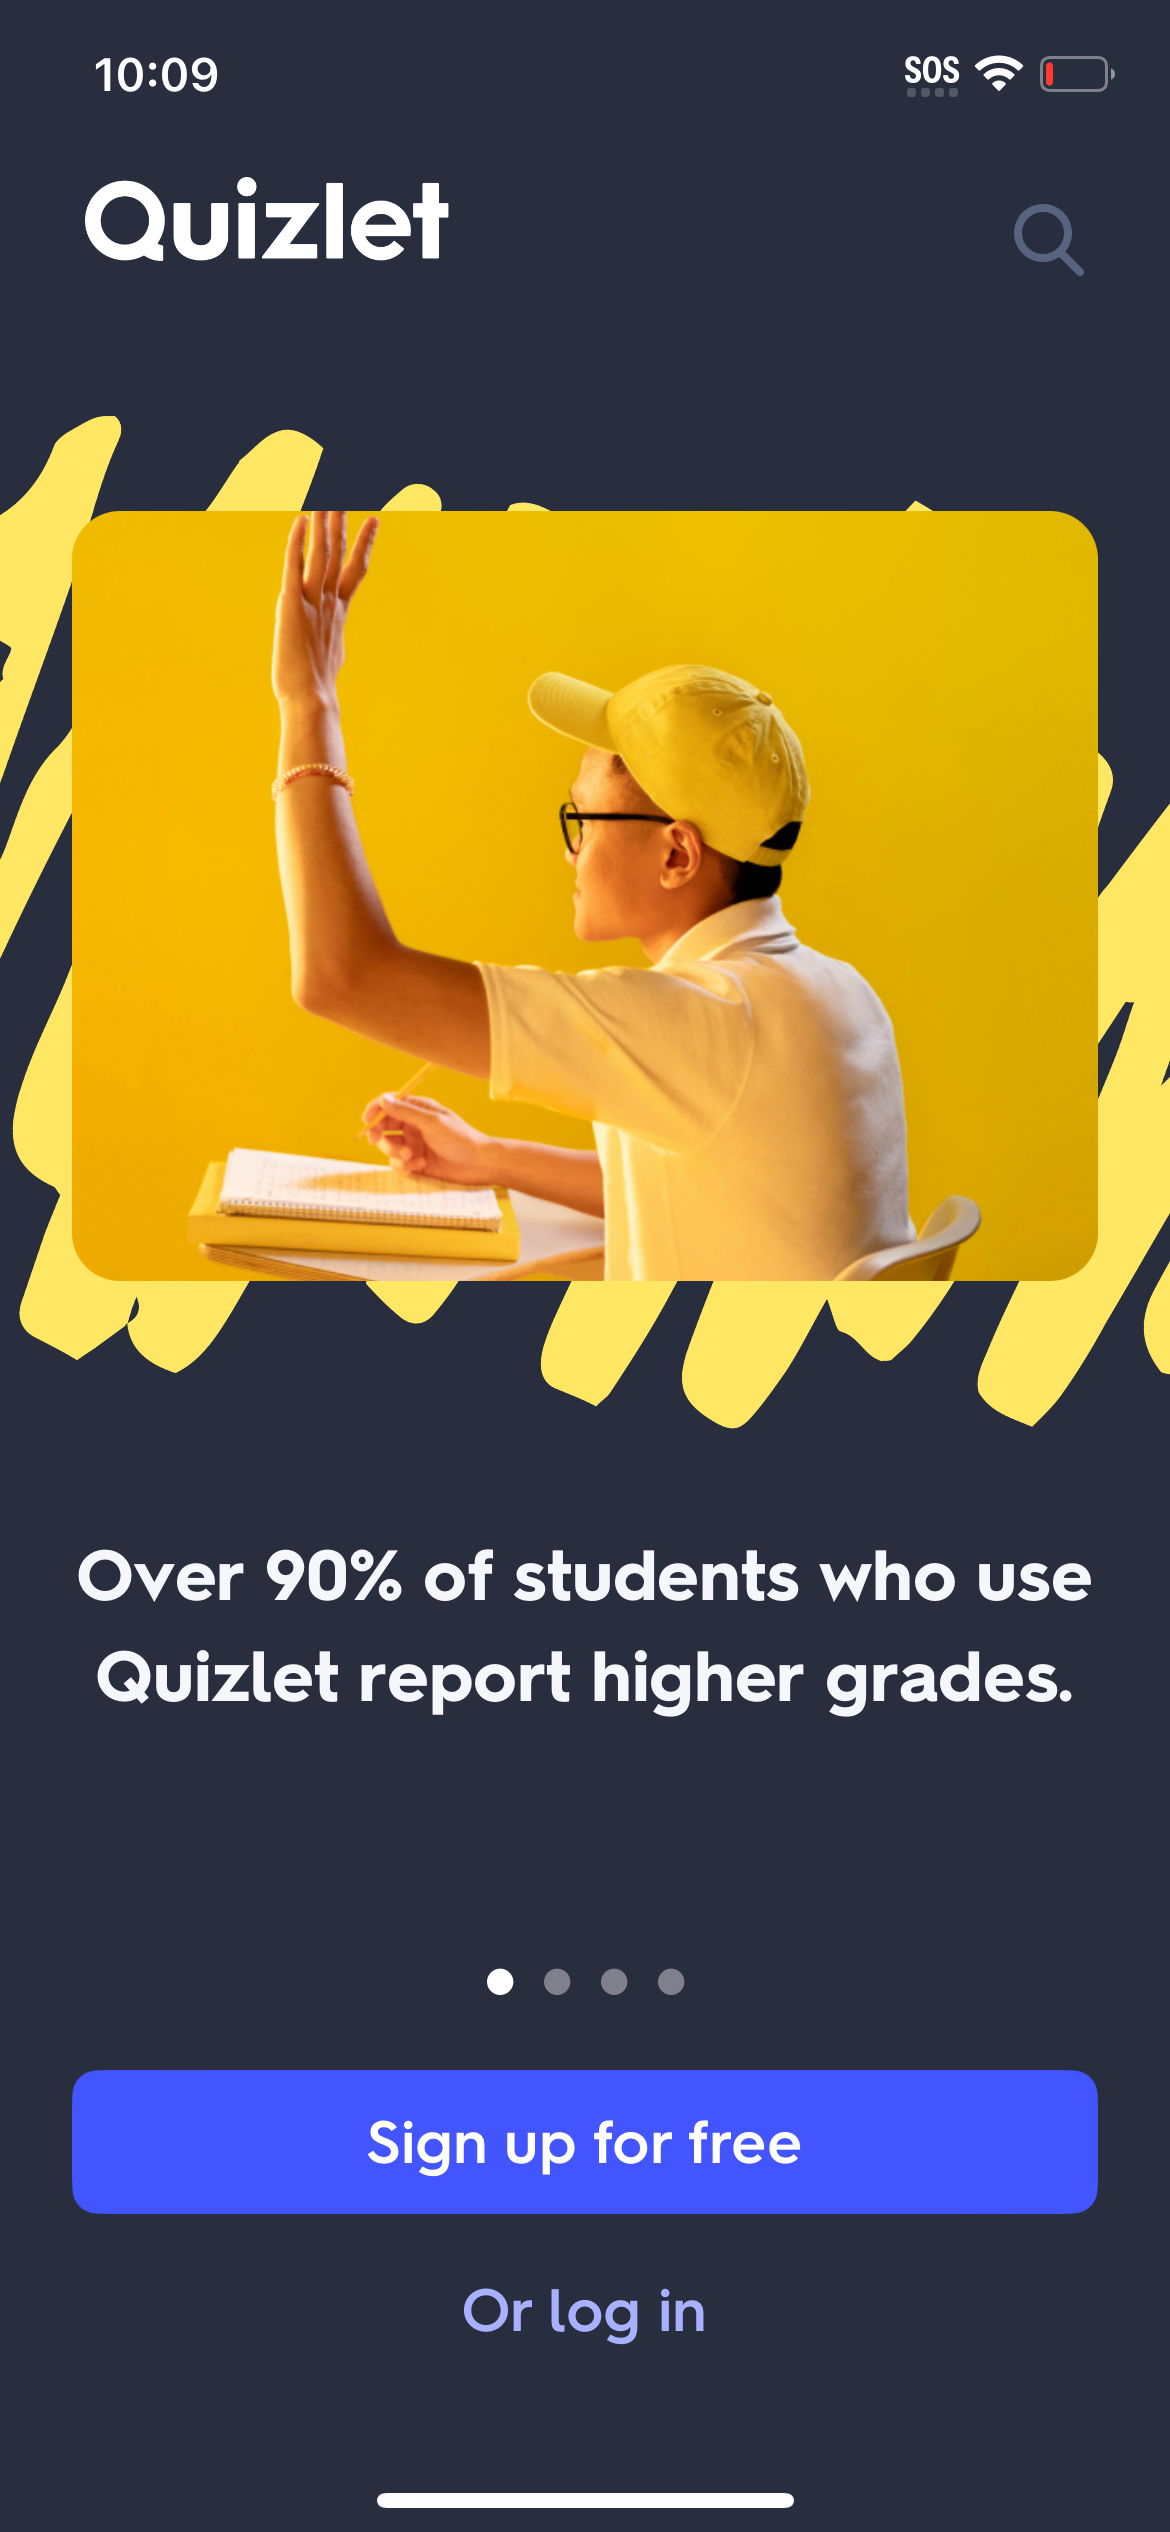
How common are cold-start or first-launch screens in mobile apps?
Cold-start screens account for 58 canonical screens across the corpus's 23,407 canonical screens [1]. That makes the dedicated first-launch / cold-start surface a relatively rare, specialized pattern…
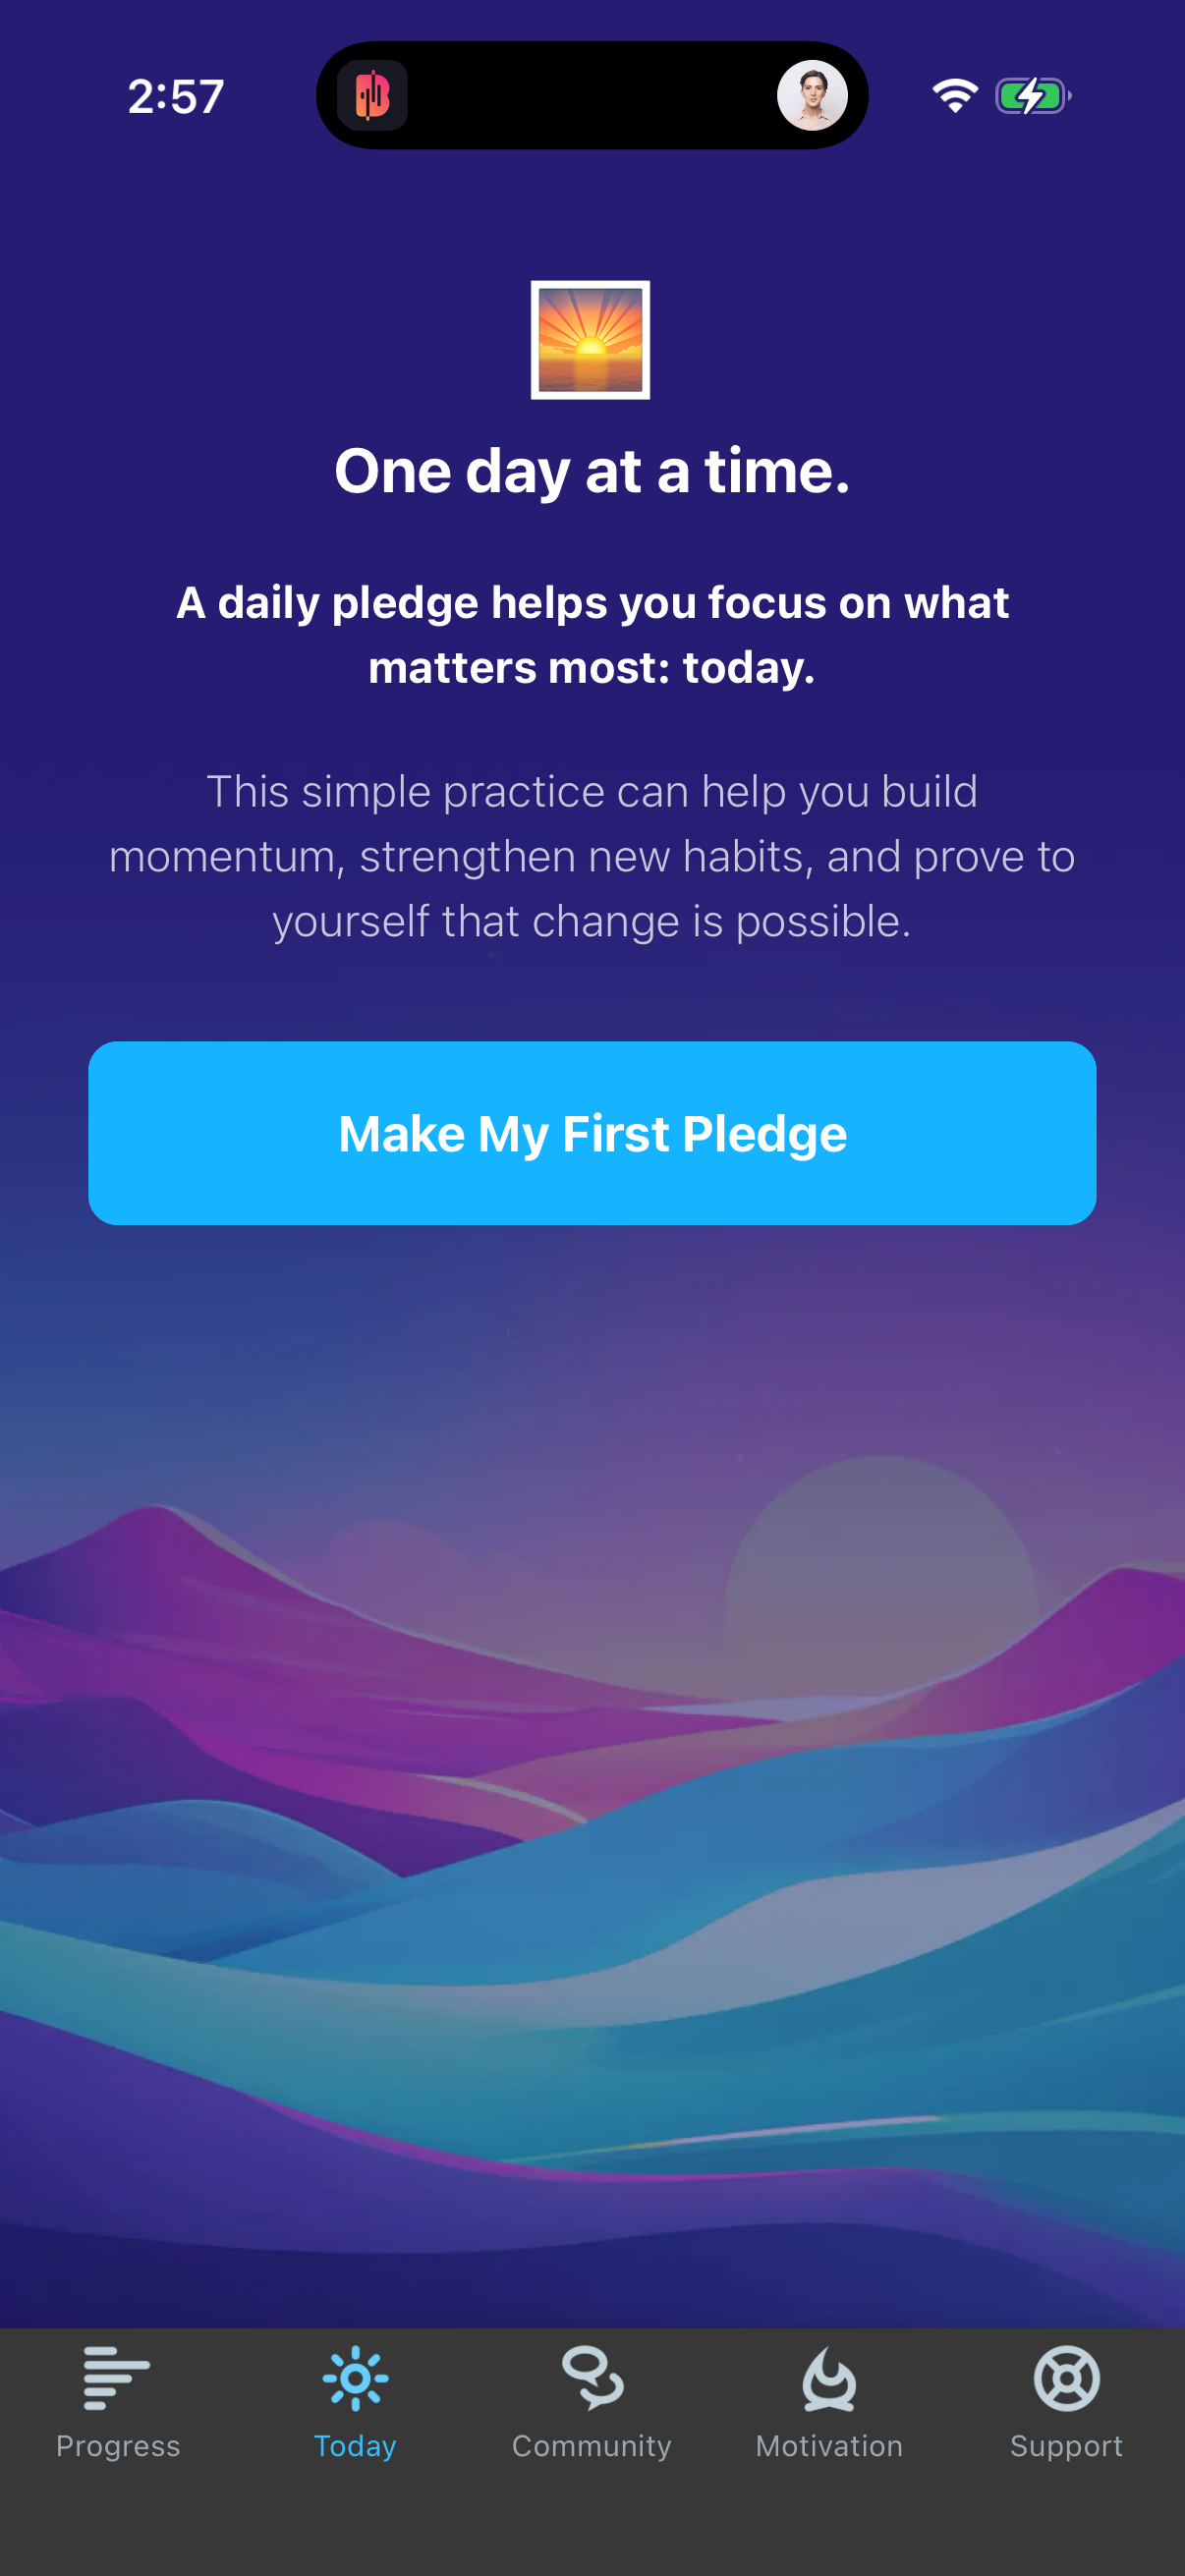
How common are in-app ad and ad-privacy screens in mobile apps?
Ad and ad-privacy screens account for 199 canonical screens across the corpus's 23,407 canonical screens [1]. That puts ad surfaces in the mid-tier of canonical categories — more common than cold-sta…
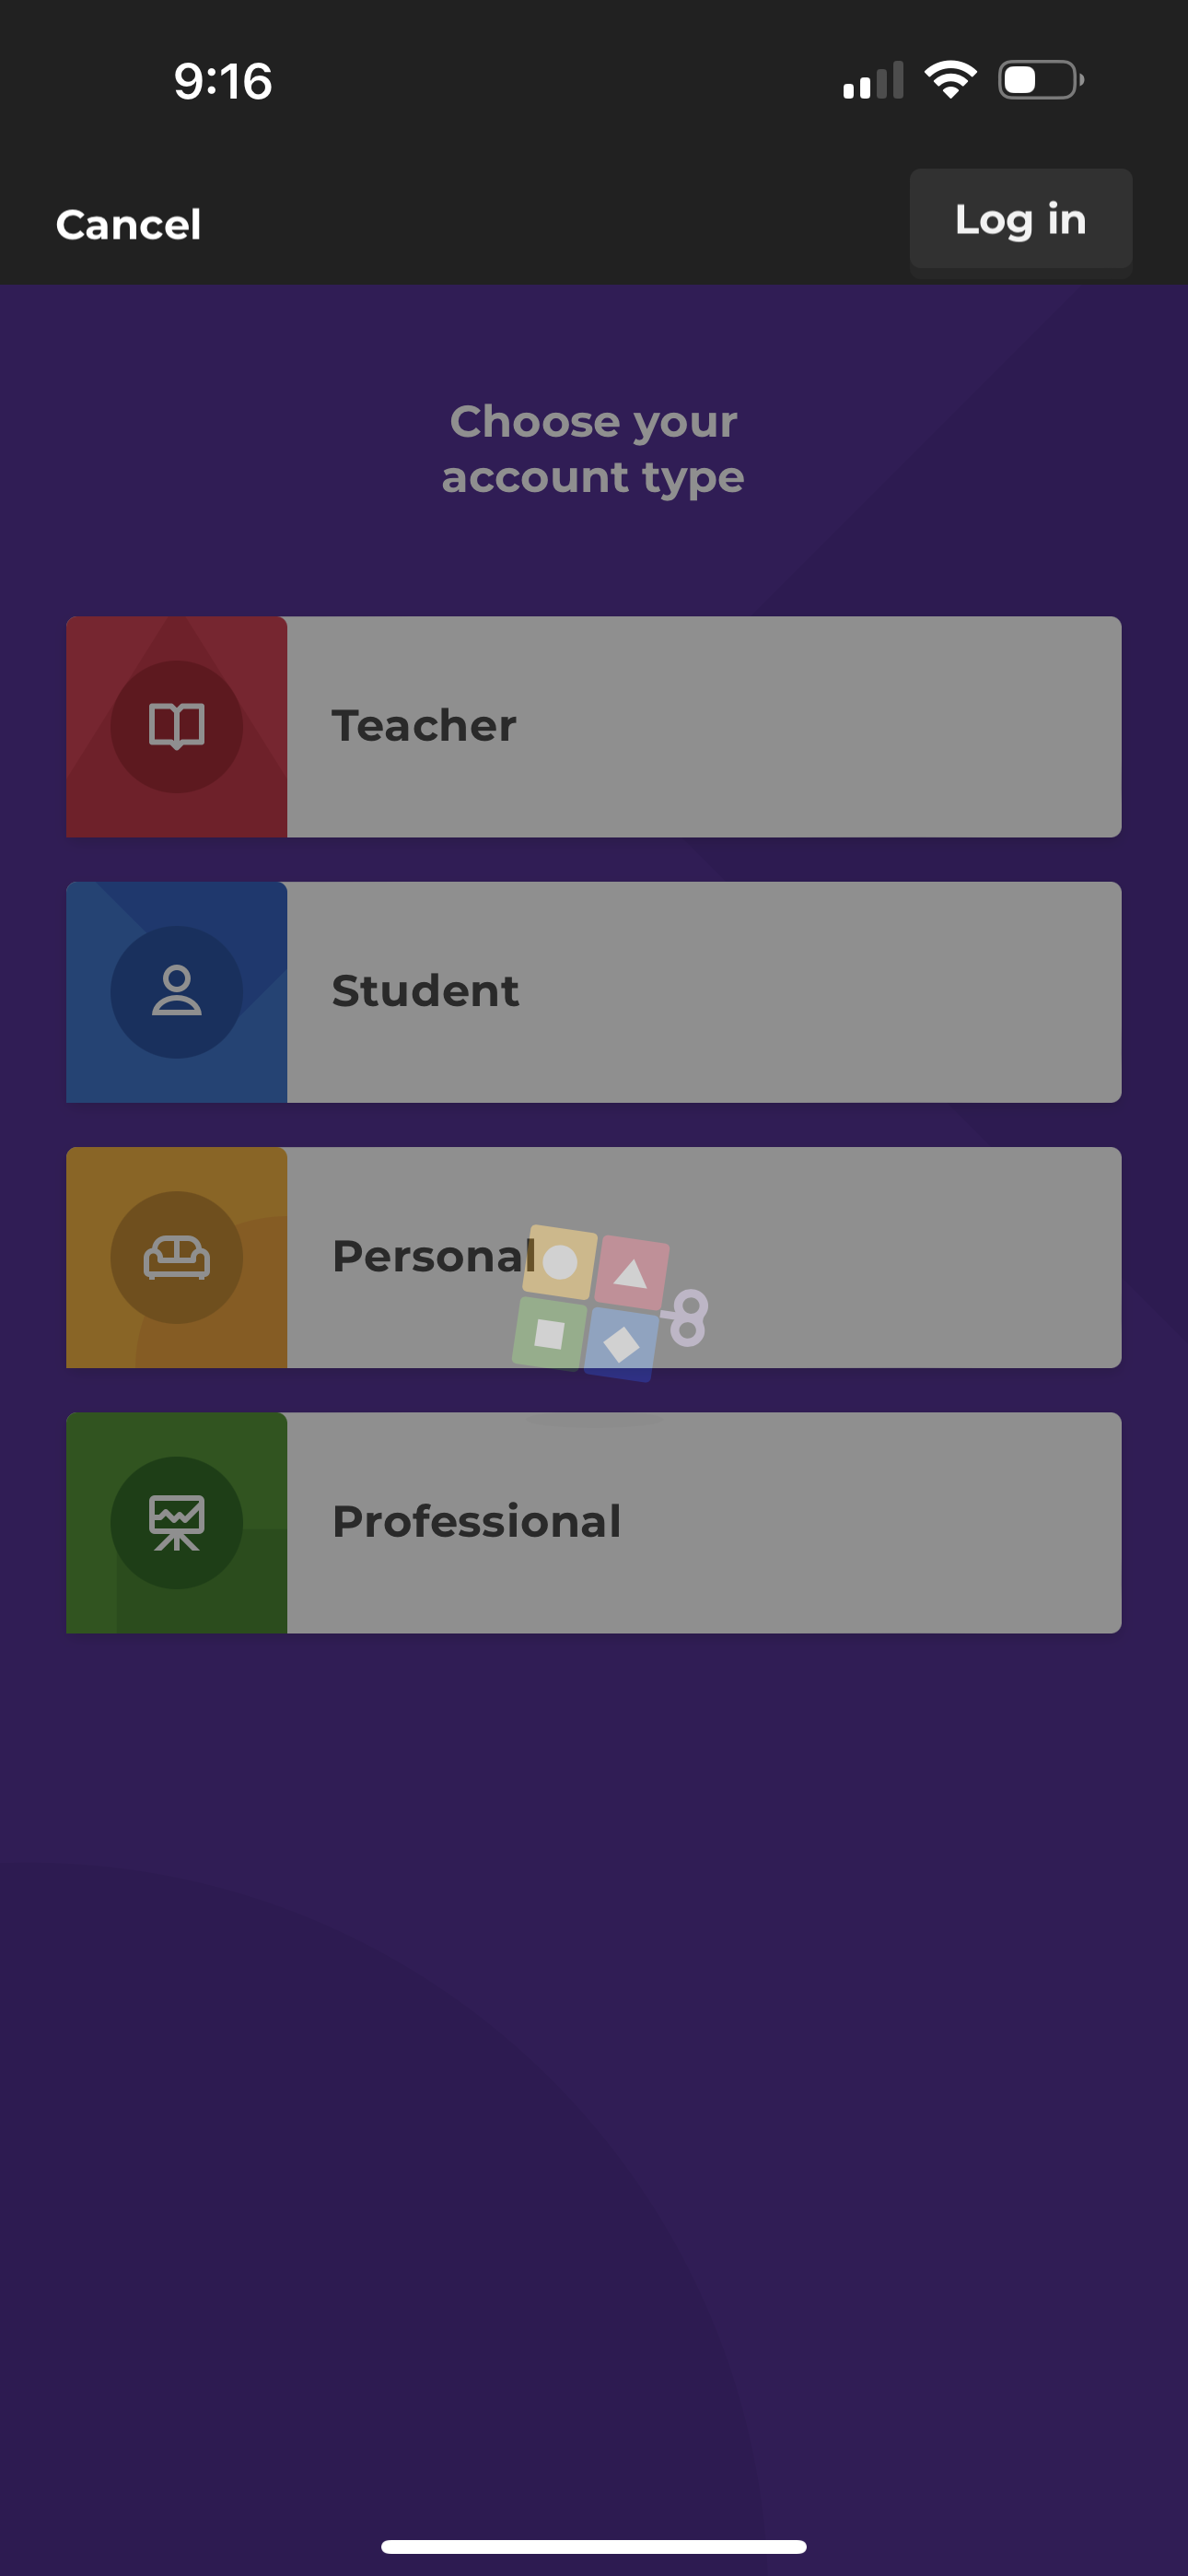
How common are streak screens in Health & Fitness apps?
50% of tracked Health & Fitness apps (28 of 56) have a captured streak screen [1]. That is more than 4x the all-app average of 11.6% (94 of 809) [2], making streaks a defining pattern of the fitness…
How common are paywalls in Health & Fitness apps?
68% of tracked Health & Fitness apps (38 of 56) have a captured paywall screen — the highest of any large vertical [1]. That is nearly 2x the all-app average of 37.7% (305 of 809) [2]. In wellness an…

How common are paywalls and streaks in Education apps?
68% of tracked Education apps (25 of 37) have a captured paywall and 51% (19 of 37) have a streak screen [1]. Both rates roughly double the all-app averages (paywall 37.7%, streak 11.6%) [2]. Educati…
What screen patterns are common — and rare — in finance and fintech apps?
Finance apps invert the wellness playbook: only 17% have a captured paywall (8 of 47), 15% have social login (7 of 47), and just 2% have a streak (1 of 47) [1]. But referral is strong at 32% (15 of 4…
What screen patterns are common in productivity apps?
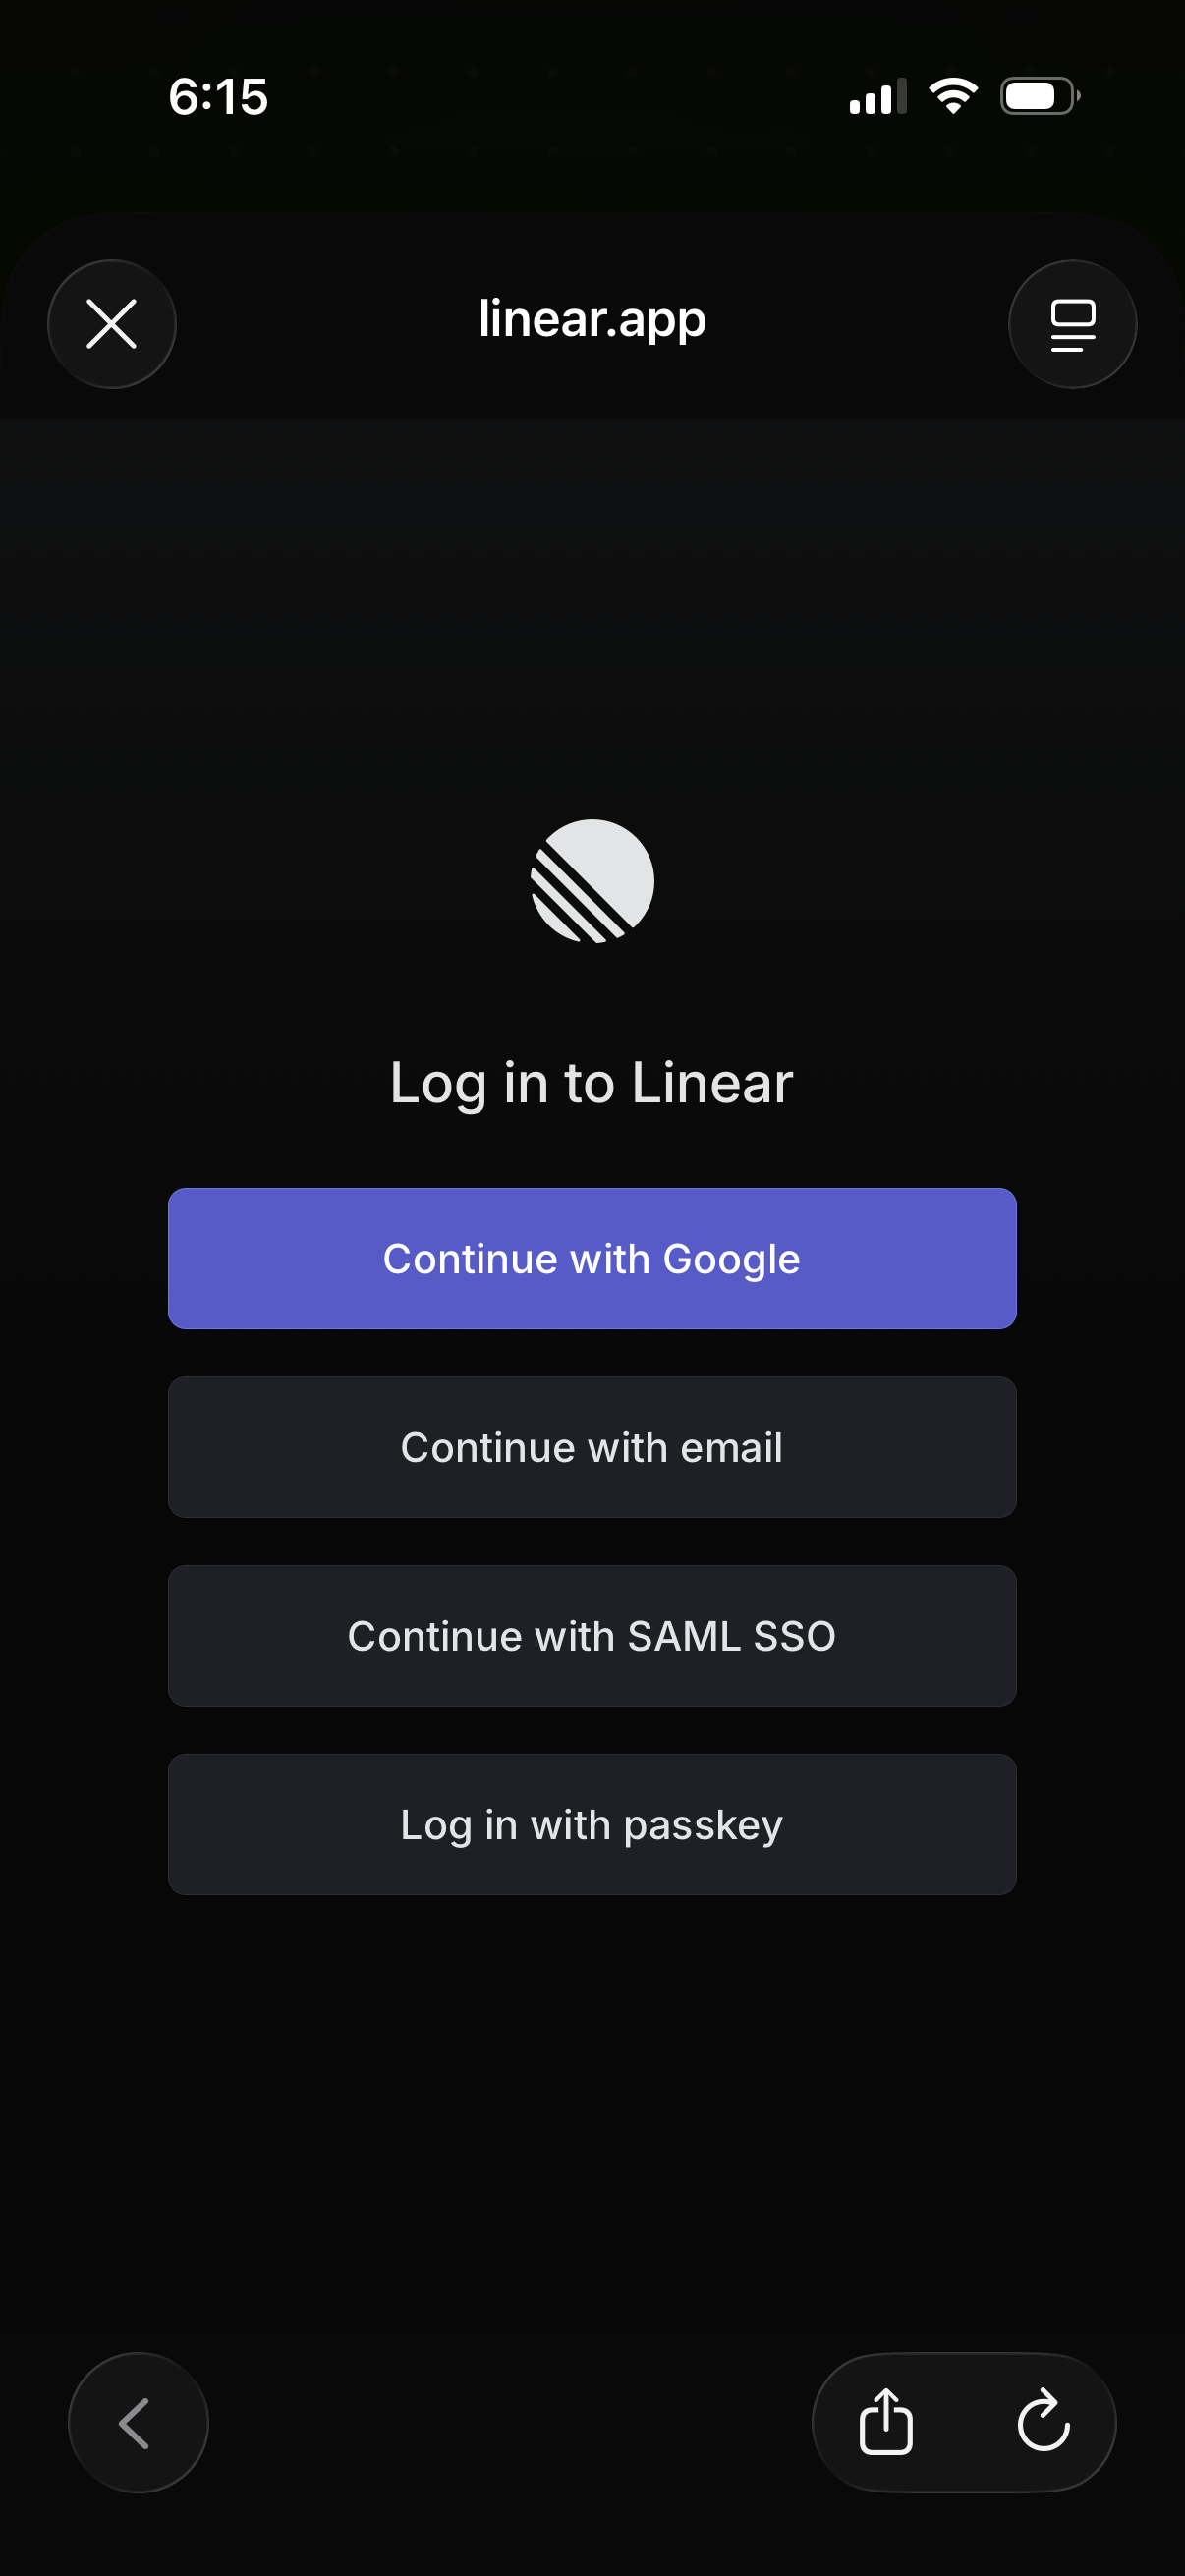
Productivity apps are middle-of-the-road on most patterns: 36% have a captured paywall (23 of 64), 39% have social login (25 of 64), and 11% have a streak (7 of 64) [1]. Referral is comparatively low…
What percent of mobile apps show an in-app rating-request screen?
12.7% of tracked apps (103 of 809) show an in-app rating-request screen [1]. A stricter canonical count puts dedicated app-rating screens at just 22 apps [2], so somewhere between ~3% and ~13% of tra…

What percent of mobile apps have a home-screen widget surface or widget upsell?
8.5% of tracked apps (69 of 809) have a captured home-screen widget surface or widget upsell [1]. So promoting a home-screen widget is a niche pattern — under 1 in 11 tracked apps — clustered in weat…
What are the most universal screens across mobile apps — and which are rare?
Settings is the most universal non-home screen, in 71.4% of tracked apps (578 of 809), followed by profile (58.0%) and search (55.6%) [1]. At the other end, onboarding quizzes (13.3%), streaks (11.6%…