How Many Onboarding Screens Do Productivity Apps Have?
Across 12 tracked Productivity onboarding flows (10 companies), the median is 11.5 screens and the average is 10.9 [1] — essentially in line with the 11-screen all-category median [2]. Lengths range from 2 to 21 screens [1]. This is a small sample, so we report medians with explicit n.
Productivity apps run a median 11.5 onboarding screens, right at the all-category median of 11 (n=12 flows, July 2026).

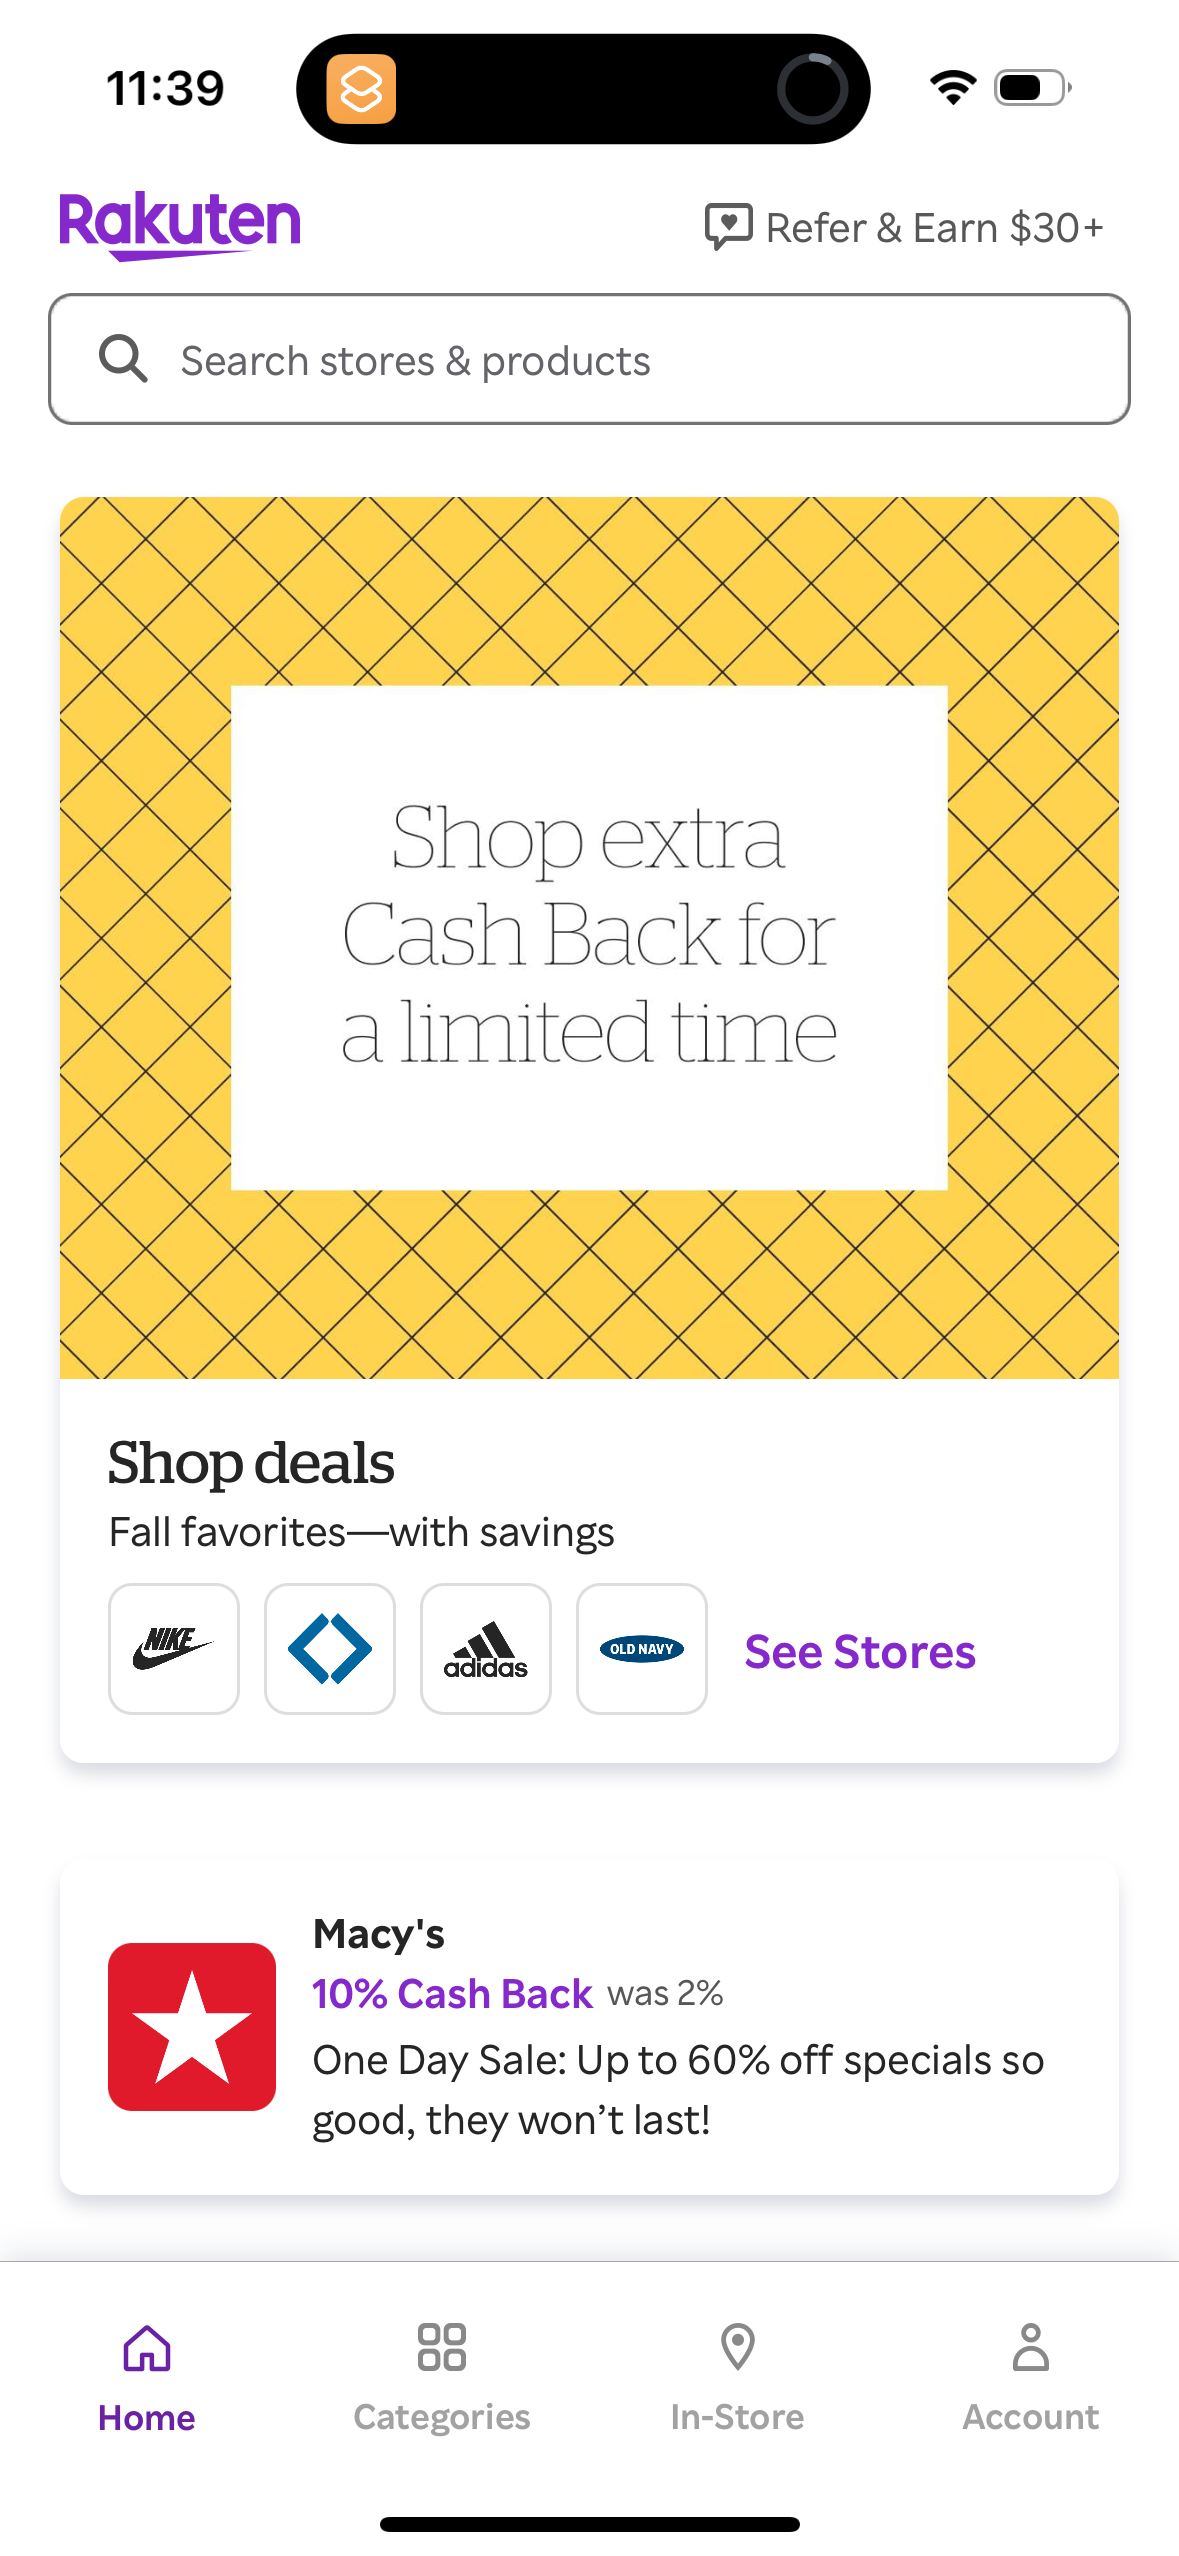
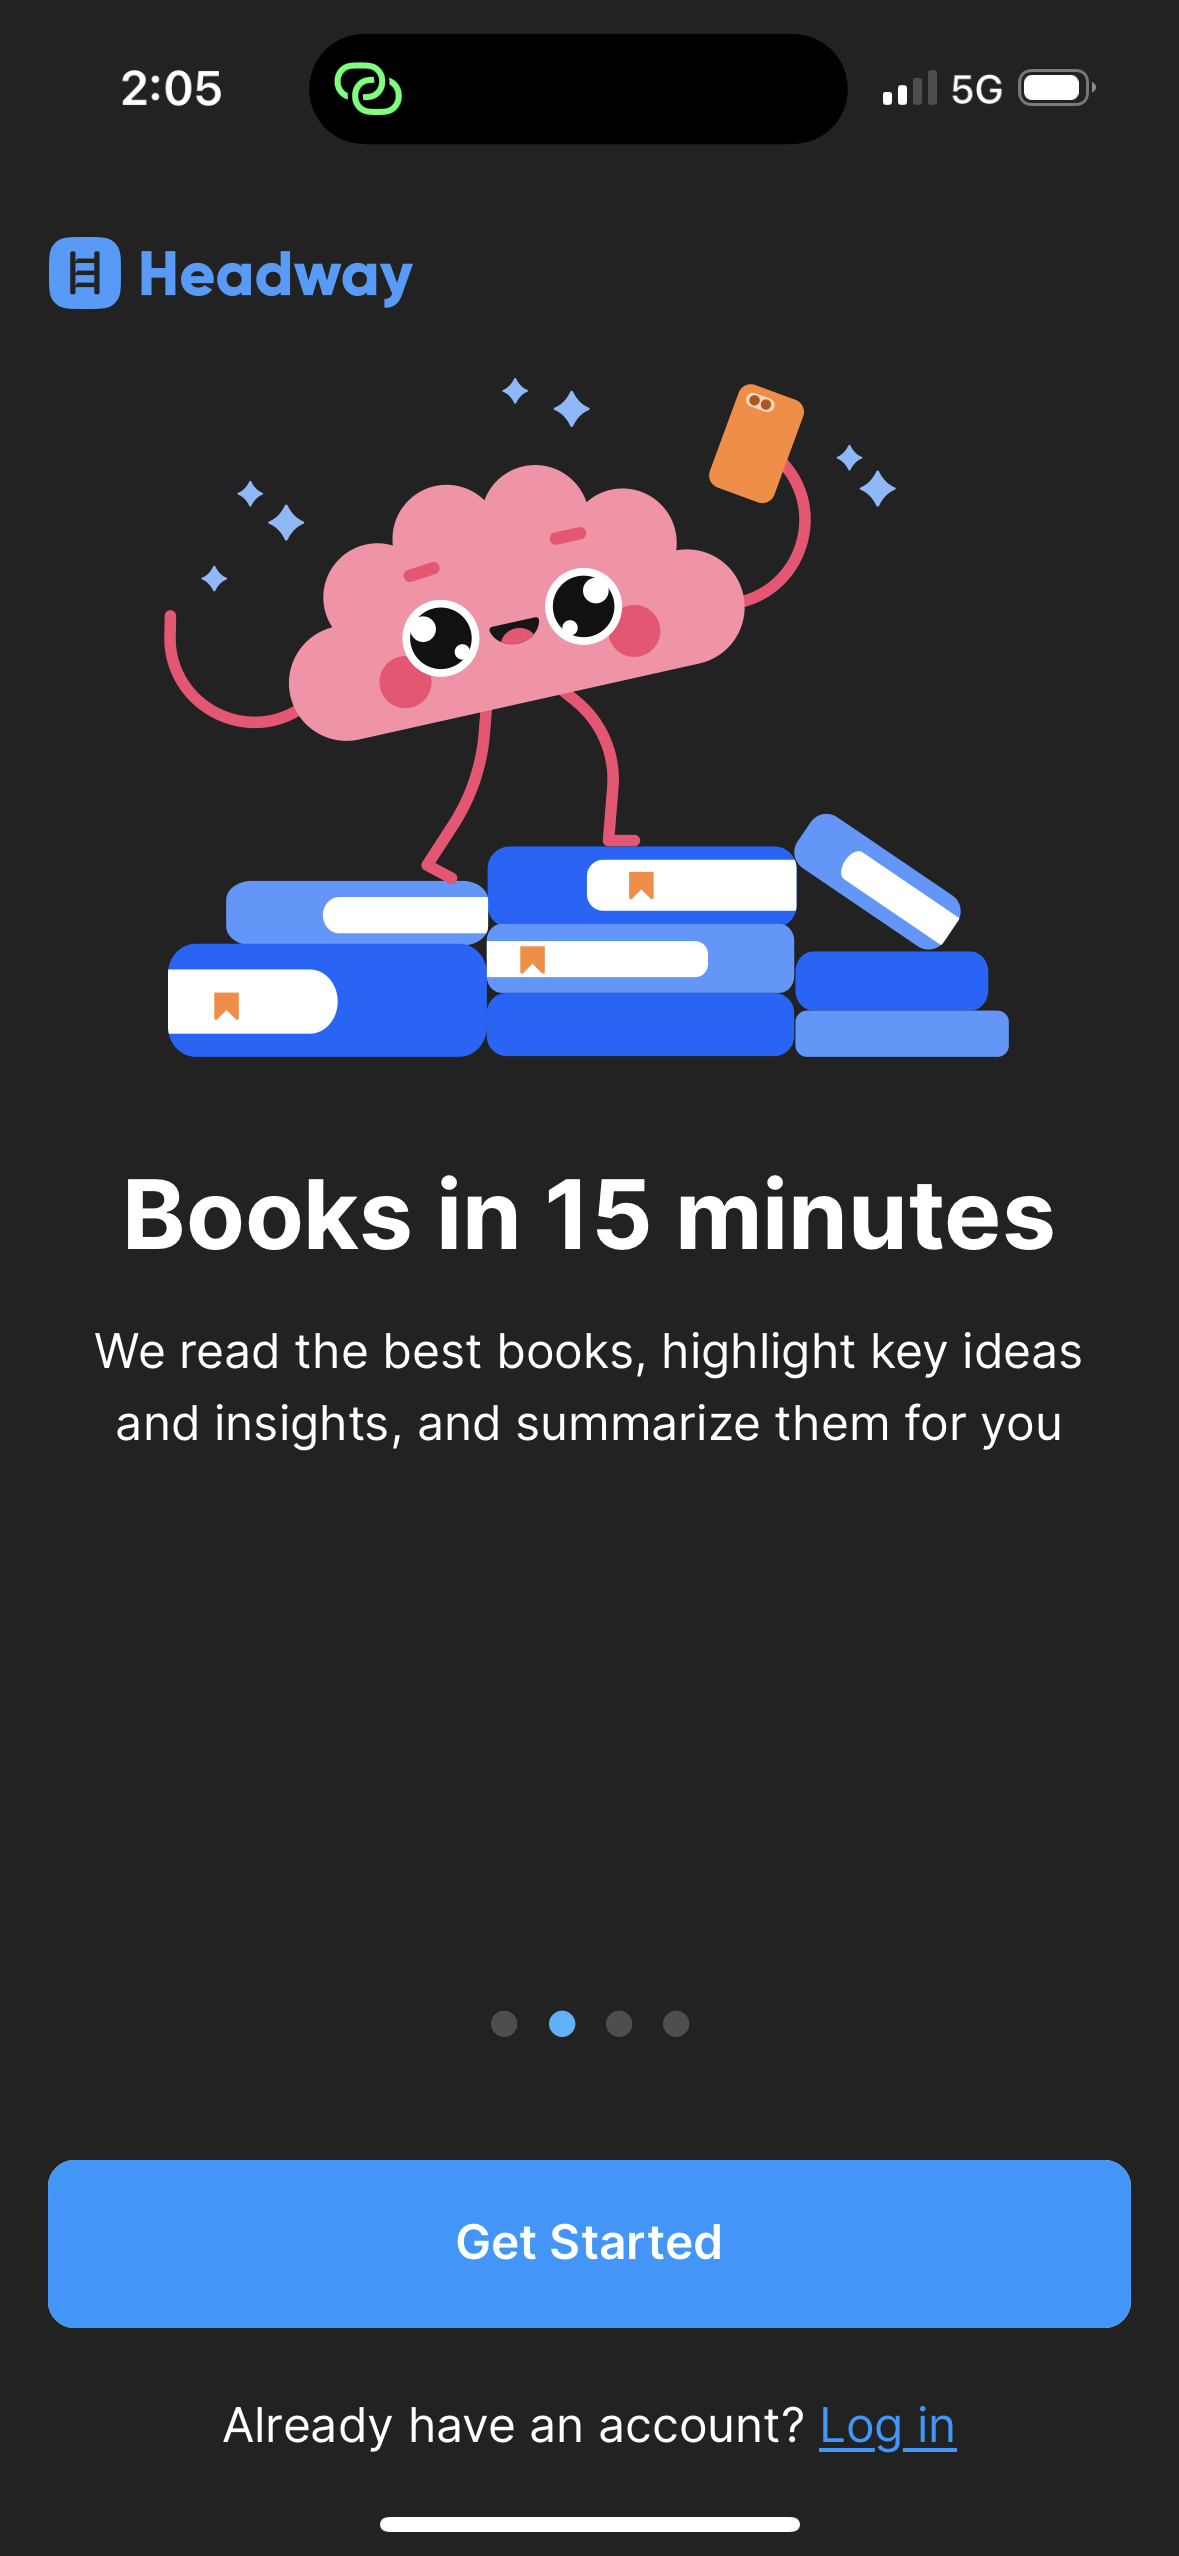
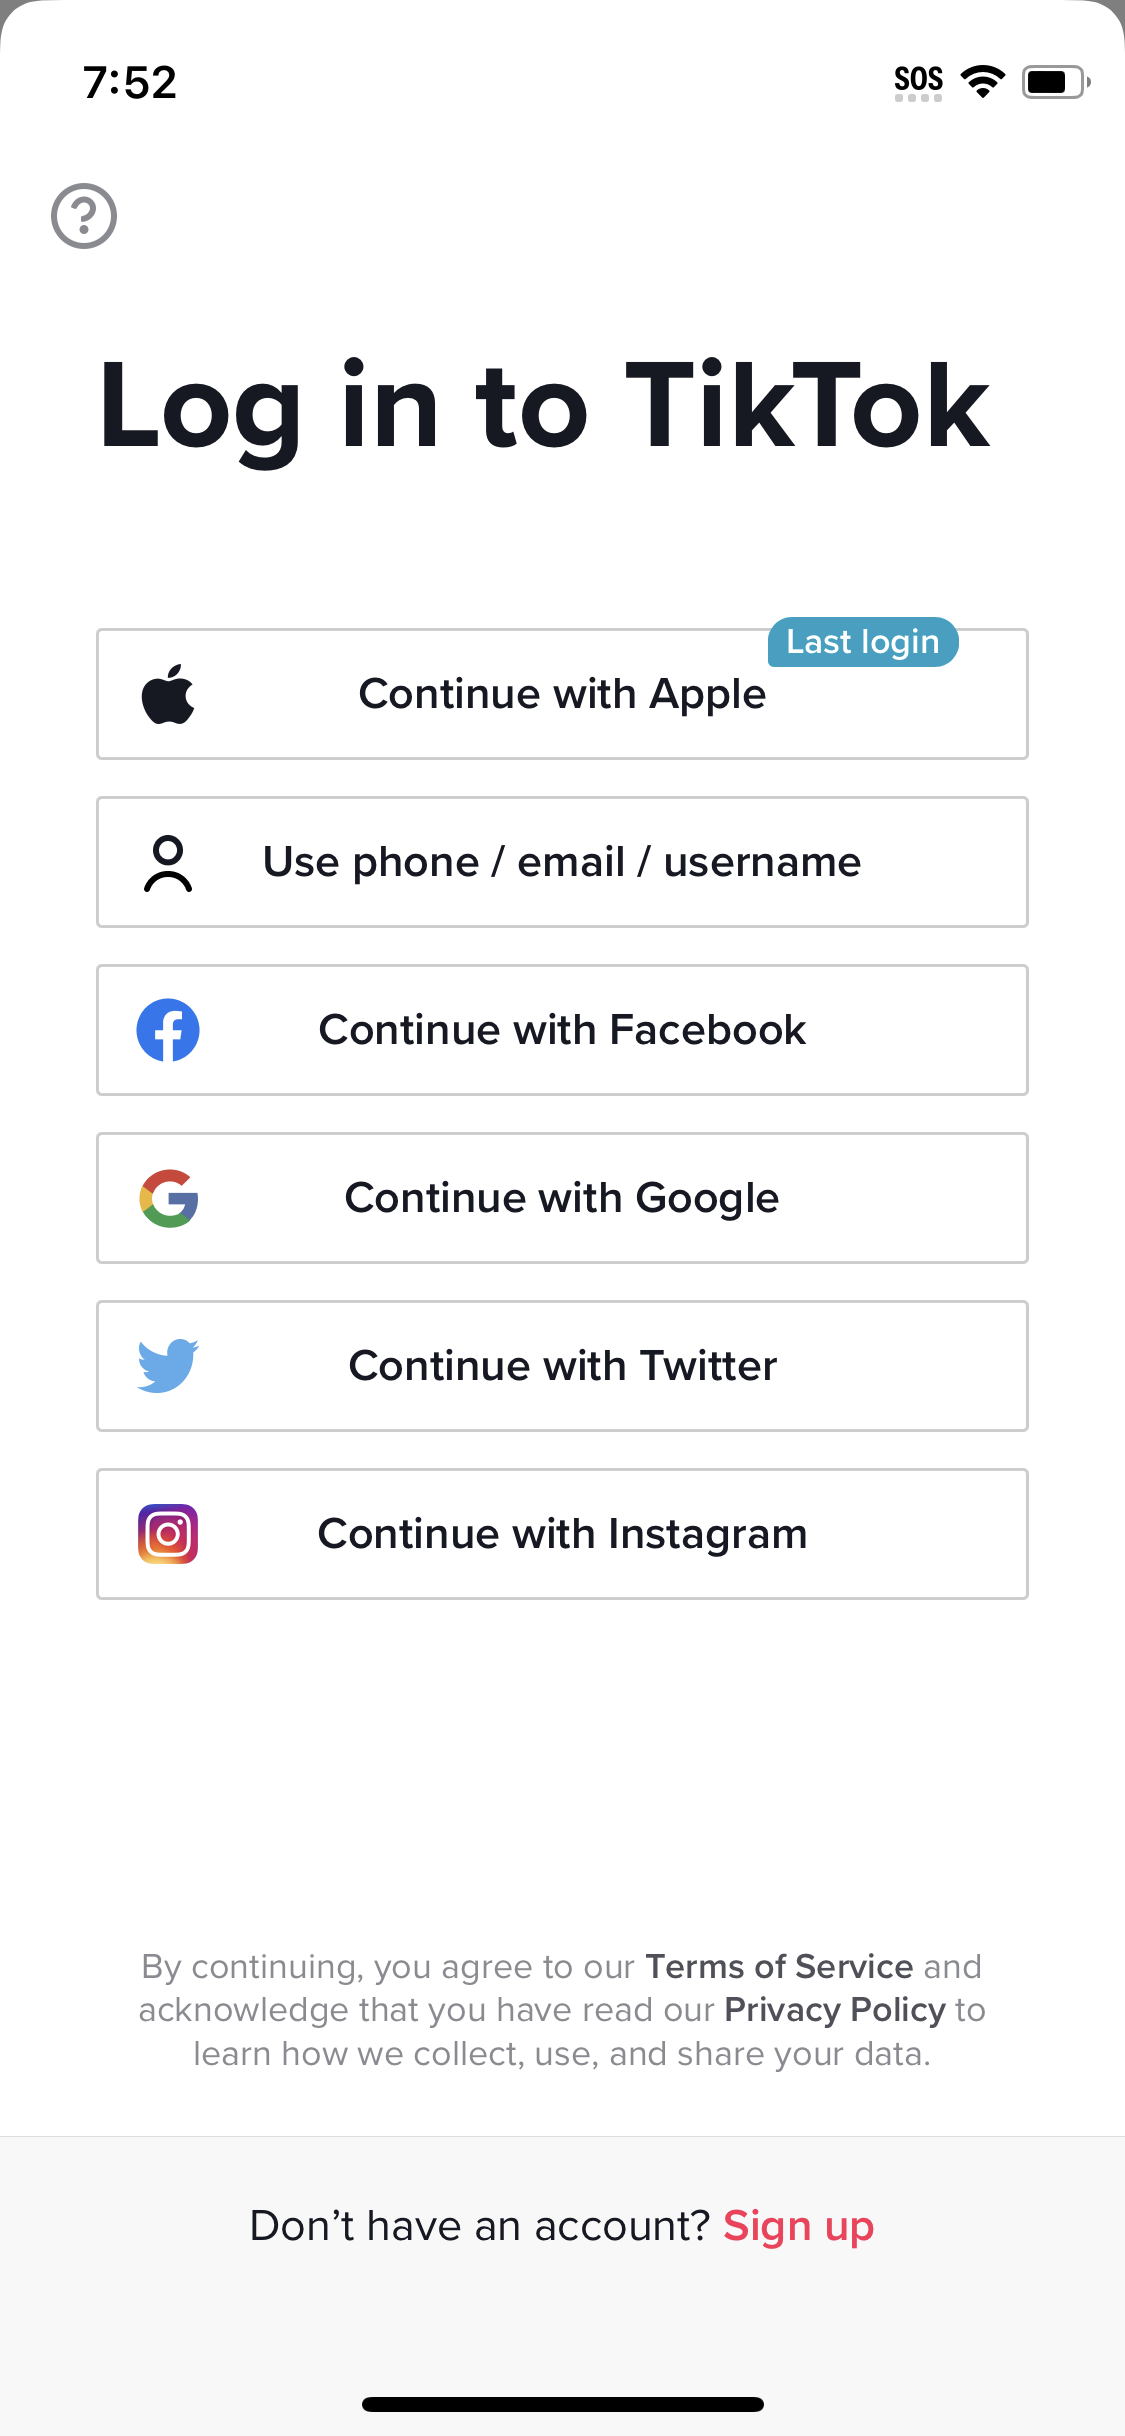
| Item | Productivity (n=12) |
|---|---|
| Average | 10.9 [1] |
| Median | 11.5 [1] |
| Range | 2-21 [1] |
The finding: right at the overall median
Productivity onboardings average 10.9 screens with a median of 11.5 across 12 flows [1]. Unlike Health & Fitness or Education, this category tracks the all-category median of 11 closely [2] — productivity apps tend to get users to value quickly rather than through long quizzes. The 2-21 range is comparatively tight [1].
Productivity vs the overall benchmark
| Metric | Productivity (n=12) | All categories (n=129) |
|---|---|---|
| Average | 10.9 [1] | 13.9 [2] |
| Median | 11.5 [1] | 11 [2] |
| Range | 2-21 [1] | 2-70 [2] |
With 12 flows across 10 companies, read these as directional.
How to apply it
If you're building a productivity tool, the median suggests ~11-12 screens is normal, and the tight range means there's little precedent for going past ~20. The lower average than median hints many productivity apps run leaner (single-digit) flows. Prioritize reaching an activation moment over collecting profile data.
The numbers
| Stat | Computed from |
|---|---|
| 12 flows / 10 companies; avg 10.9; median 11.5; range 2-21 | category_productivity |
| all-category avg 13.9; median 11; range 2-70 | onboarding_headline_distribution |
Sources & citations
- [1] Lazyweb Research analysis of 12 Productivity onboarding flows (10 companies), July 2026. Small-sample category cut; median + range with explicit n. ↩
- [2] Lazyweb Research analysis of 129 canonical onboarding flows (subset of 2,468 tracked flows), July 2026. All-category baseline. ↩
Source: Lazyweb Research — proprietary analysis of real, in-market app screens. Cite as Lazyweb Research, 2026-07-07.